
Figure 3.
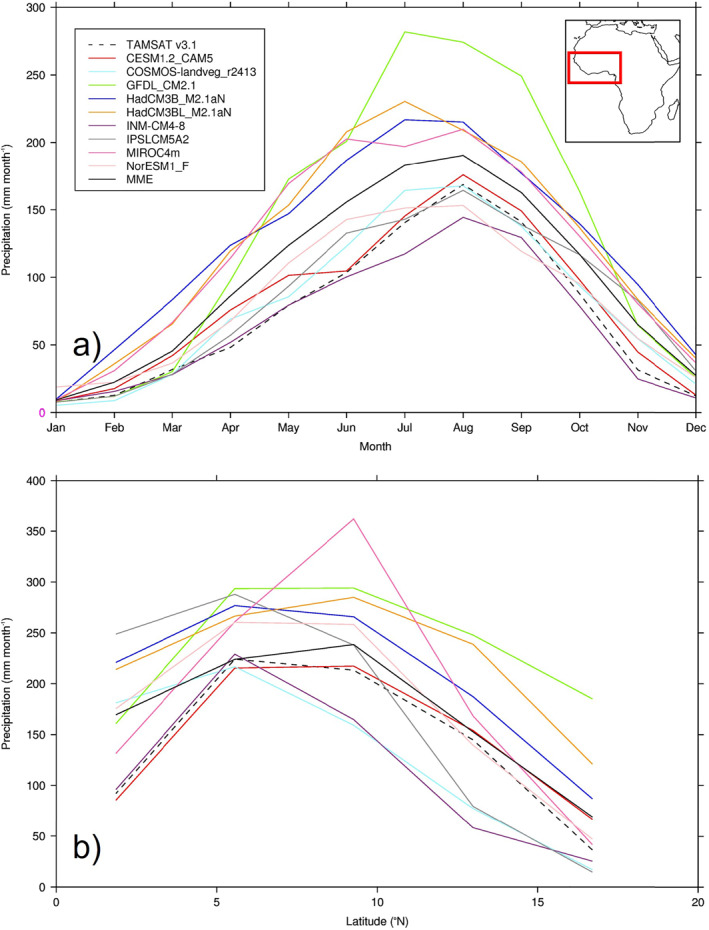
Precipitation climatology from TAMSAT and PI simulations, averaged over West Africa (20°W–15°E, 0°–20°N‐land points only): (a) Mean seasonal cycle, at each model's individual spatial resolution; (b) Zonal mean of June–August (JJA) precipitation, re‐gridded to lowest common spatial resolution.