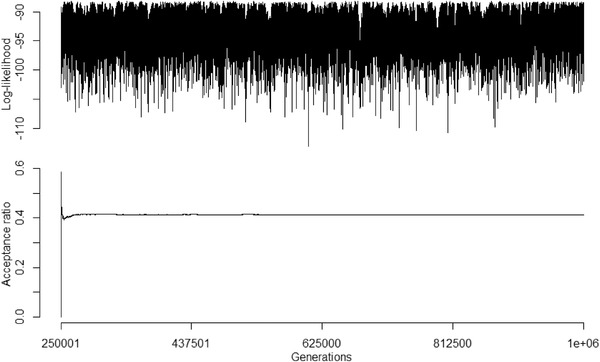
Figure A4.

Log‐likelihood trace plot and acceptance ratio of the second evolutionary rate matrix MCMC chain. MCMC chain ran for 1 million generations, with the first 25% discarded as burnin and sampling every 1000 generations. Acceptance ratio for the MCMC chain was ∼0.41 (correlation = 0.62; standard deviation = 0.15; root = 0.93).
