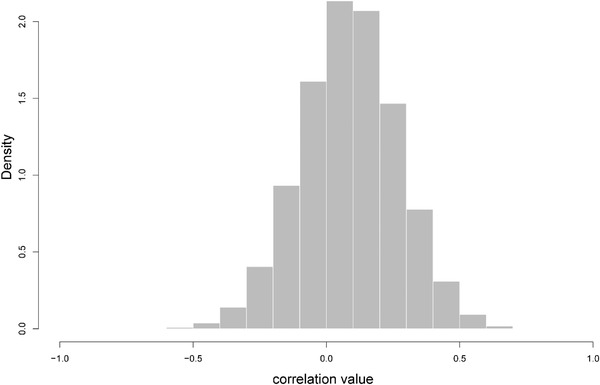
Figure A6.

Histogram of the posterior distribution of evolutionary correlation among log total body length and sea surface temperature, extracted from the two merged MCMC chains. Minimum = −0.68; 1st quartile = −0.03; Median = 0.09; Mean = 0.09; 3rd quartile = 0.21; Maximum = 0.79.
