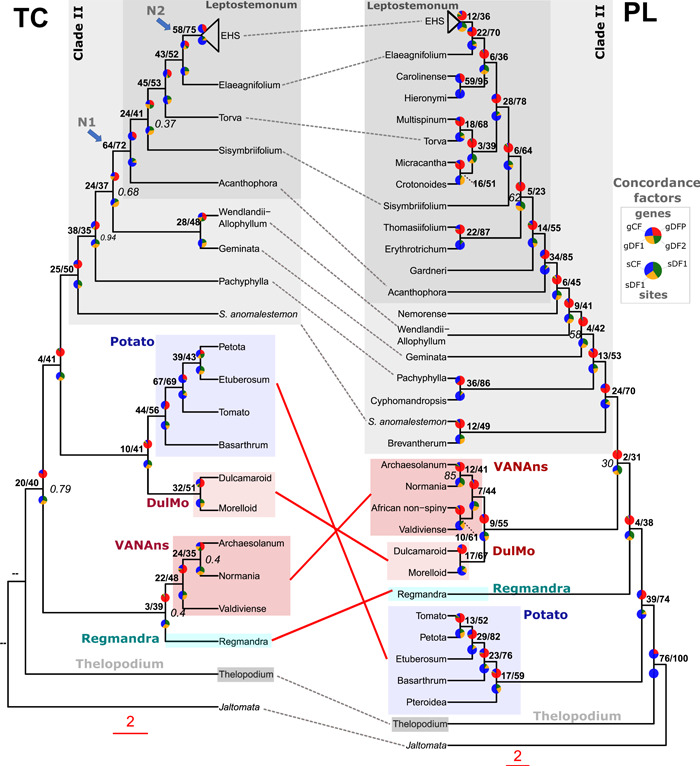
Figure 4.

Discordance analyses within and between the plastome (PL) and target capture (TC) phylogenomic datasets across Solanum. Rooted TC ASTRAL‐III phylogeny (left) and PL IQ‐TREE2 phylogeny (right) with gene concordance factor (gCF) and site concordance factor (sCF) values shown as pie charts, above and below each node respectively; the PL topology is the unpartitioned ML analysis of 151 taxa, whereas the TC topology is based on the analysis of 40 taxa and 303 genes recovered from the A353 bait set. Both trees have been pruned to retain a single tip for each of the major and minor clades present within the PL and TC datasets. For gCF pie charts, blue represents proportion of gene trees concordant with that branch (gCF), green is proportion of gene trees concordant for 1st alternative quartet topology (gDF1), yellow support for 2nd alternative quartet topology (gDF2), and red is the gene discordance support due to polylphyly (gDFP). For the sCF pie charts: blue represents proportion of concordance across sites (sCF), green support for 1st alternative topology (quartet 1), and yellow support for 2nd alternative topology (quartet 2) as averaged over 100 sites. Percentages of gCF and sCF are given above branches, in bold. Branch support (local posterior probability) values ≥0.95 are not shown, and 0.94 and below are shown in italic grey, on the right; double‐dash (‐‐) indicates that the branch support was unavailable due to rooting of the phylogenetic tree.
