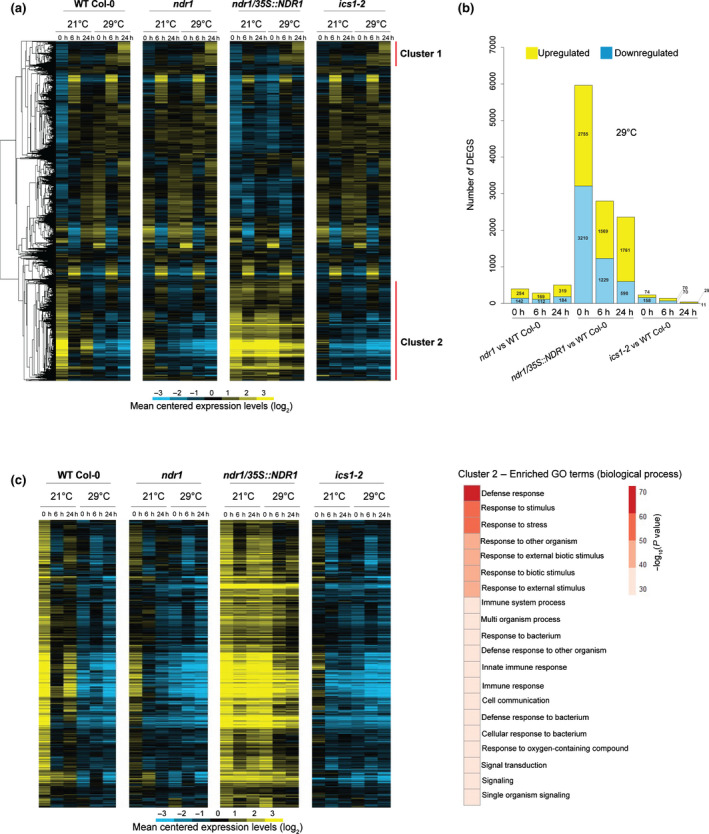
Fig. 1.

Temporal dynamics of transcriptome responses to heat stress through Non‐Race‐Specific Disease Resistant1 (NDR1)‐dependent immune activation in Arabidopsis. (a) Heat map showing log2‐fold gene expression changes over the 24 h heat stress. (b) Number of differentially expressed genes (DEGs) at 29°C over a 24 h time course in the ndr1, NDR1‐overexpression, and ics1‐2 mutant plants. (c) Heat map showing log2‐fold gene expression changes in cluster 2 genes that are highly expressed in ndr1/35S::NDR1 plants and are related to defense response and immune system based on Gene Ontology (GO) enrichment analysis. Blue indicates negative values, yellow indicates positive values, and black indicates zero.
