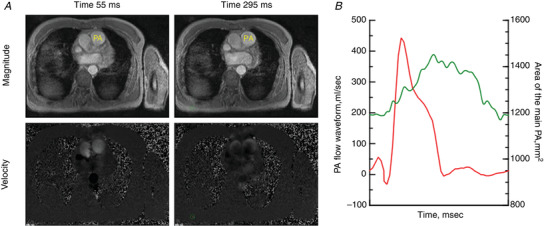
Figure 2. Cardiac magnetic resonance velocity quantification.

Cardiac magnetic resonance velocity quantification in the main pulmonary artery (PA) A, magnitude (top) and velocity (bottom) images of the main PA at two time‐points. B, curves of PA flow (red) and the area of the main PA (green) during a whole cardiac cycle. [Colour figure can be viewed at wileyonlinelibrary.com]
