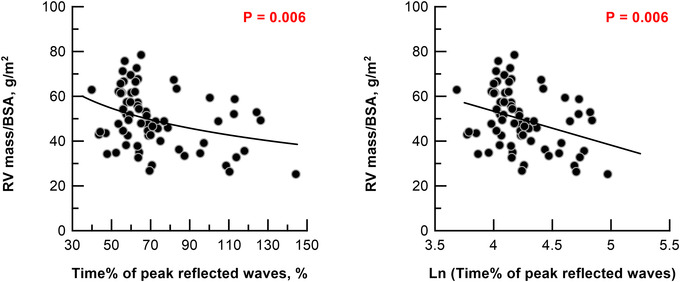
Figure 6. Linear regression analysis.

Linear regression analysis with logarithm of time of peak reflected waves as the indicator of RV mass/BSA. RV, right ventricle. The x‐axis is represented by a linear scale. RV mass/BSA = −15 × ln (time% of reflected waves) + 114. The number of analysed patients was 63 for diastolic returners. [Colour figure can be viewed at wileyonlinelibrary.com]
