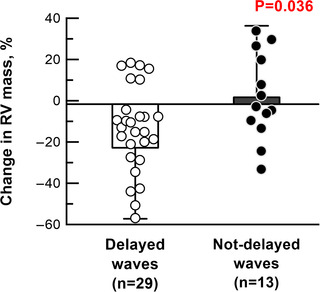
Figure 8. Change in RV mass after PAH treatment.

Change in RV mass in patients with delayed waves (n = 29) and not‐delayed waves (n = 10) after PAH treatment. Change in RV mass (%) was determined as: (RV mass/BSAfollow‐up − RV mass/BSAbaseline)/RV mass/BSAbaseline ×100. One patient with delayed waves was excluded as a result of the unavailability of RV mass/BSA at follow‐up. [Colour figure can be viewed at wileyonlinelibrary.com]
