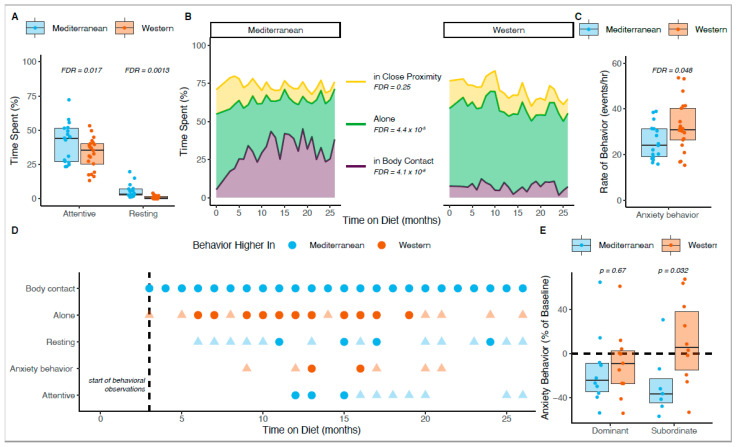
Figure 2.
Changes in behavior following experimental diet treatments. (A) Monkeys in the Mediterranean group (blue boxes and points) spent more time attentive (ANCOVA F [1,35] = 8.6, FDR = 0.017) and resting (AVOVA F [1,36] = 15.6, FDR = 0.0013) than those in the Western group (orange boxes and points). (B) The left plot shows how monkeys in the Mediterranean group spent time in proximity to one another, while the right plot shows the same for monkeys in the Western group. Monkeys in the Mediterranean group spent more time in body contact (ANCOVA F [1,35] = 60.8, FDR = 4.1 × 10⁻⁸; purple) and less time alone (ANCOVA F [1,35] = 27.4, FDR = 4.4 × 10⁻⁵; green) than the Western group, while there was no significant difference in time spent in close proximity (ANCOVA F [1,35] = 0.8, FDR = 0.25; yellow). (C) The rate of anxiety behaviors observed in the Western group was significantly higher than in the Mediterranean group during the treatment phase (ANCOVA F [1,35] = 5.9, FDR = 0.048). (D) Points indicate months in which there was a significant difference between diet groups for a particular behavior. Circular points are significant after correcting for the multiple hypothesis test, whereas triangular points are those that do not pass the heightened threshold. Blue (Mediterranean) or orange (Western) points indicate which group displayed more of the behavior for that month. (E) Dominant monkeys in both diet groups decreased anxiety from baseline (left), although there was no significant difference in change in anxiety between diet groups (t(18.3) = 0.67). Only subordinates fed the Mediterranean diet decreased from baseline (right). Within subordinate animals, anxiety decreased significantly more in the Mediterranean group than in the Western group (t(14.9) = 2.37, p = 0.032).

