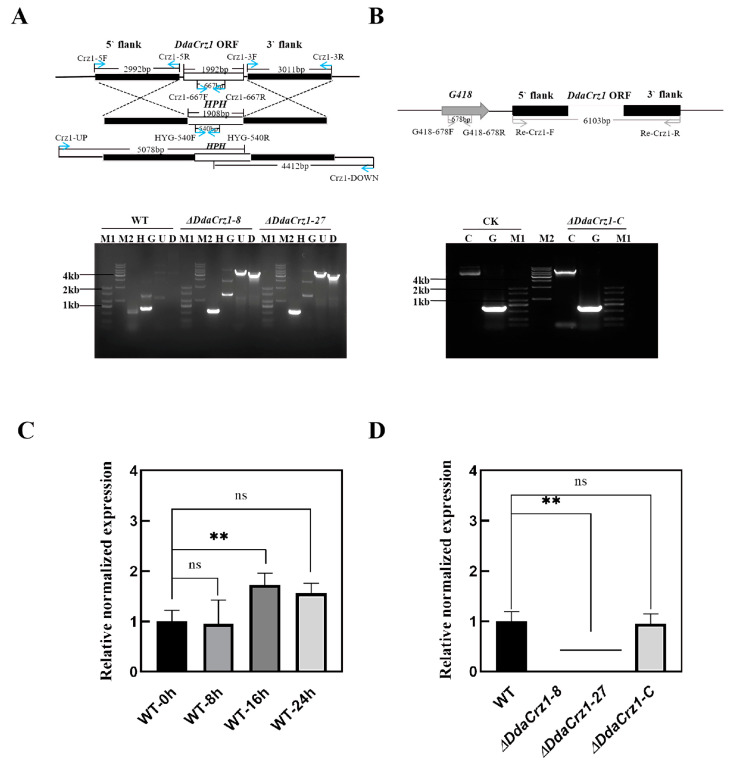
Figure 2.
Strategies used for gene disruption and complementation and characterization of the resulting strains. (A) The strategy used for disrupting DdaCrz1. The primer locations and expected PCR product lengths are indicated. The gel image shows WT, the wild-type strain; M1, DNA marker D2000; M2, DNA marker 1 kb; H, part of the hygromycin resistance gene amplified using primers HYG-540F and HYG-540R, which was absent in WT and present in the mutants; G, part of the DdaCrz1 open reading frame (ORF) amplified using primers Crz1-667F and Crz1-667R, which was absent in the mutants and present in WT; U, PCR products using primers Crz1-UP and HYG-540R; and D, PCR products using primers Crz1-DOWN and HYG-540F. (B) The strategy used to complement ΔDdaCrz1. The region amplified by PCR for complementation, primer locations, and expected PCR sizes are indicated. The gel image shows CK, the complementary plasmid used as a control; M1, DNA marker D2000; M2, DNA marker 1 kb; C, the complementary cassette detected using primers Re-Crz1-F and Re-Crz1-R; G, part of the G418 resistance gene amplified using primers G418-617F and G418-617R. (C,D) Quantitative real-time PCR of DdaCrz1. Two asterisks mean p-value < 0.01, two-tailed t-test, n = 3. ns means no significance found. (C) Expression patterns of DdaCrz1 in the wild-type strain during the predation process. The samples analyzed include 0 h (without nematodes) and 8, 16, and 24 h after inducing with nematodes. (D) Expression levels of DdaCrz1 in two DdaCrz1 deletion mutants and one complemented DdaCrz1 mutant without nematodes.

