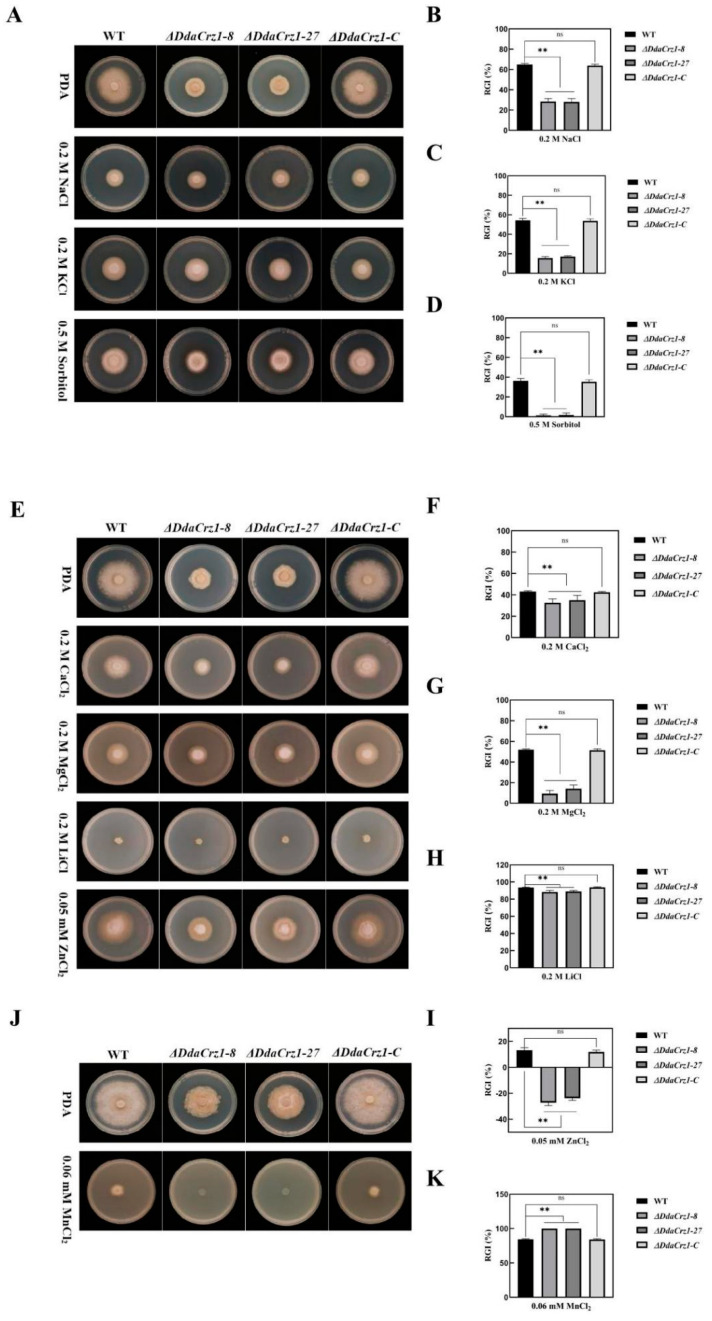
Figure 5.
Colony morphology and growth under osmotic stresses and metal cation stresses. (A) Colony morphology of strain 29 (WT), ΔDdaCrz1, and ΔDdaCrz1-C on potato dextrose agar (PDA) containing 0.2 M NaCl, 0.2 M KCl, and 0.5 M sorbitol. (B–D) Relative growth inhibition rates of the WT, ΔDdaCrz1, and ΔDdaCrz1-C strains on PDA containing 0.2 M NaCl, 0.2 M KCl, and 0.5 M sorbitol. (E) Colony morphology of the WT, ΔDdaCrz1, and ΔDdaCrz1-C strains on potato dextrose agar (PDA) containing 0.2 M CaCl2, 0.2 M MgCl2, 0.2 M LiCl, and 0.05 mM ZnCl2. (F–I) Relative growth inhibition rates of the WT, ΔDdaCrz1, and ΔDdaCrz1-C strains on PDA containing 0.2 M CaCl2, 0.2 M MgCl2, 0.2 M LiCl, and 0.05 mM ZnCl2. (J) Colony morphology of the WT, ΔDdaCrz1, and ΔDdaCrz1-C strains on PDA containing 0.06 mM MnCl2. (K) Relative inhibition rates of the WT, ΔDdaCrz1, and ΔDdaCrz1-C strains on PDA medium containing 0.06 mM MnCl2. Two asterisks mean p-value < 0.01, two-tailed t-test, n = 5. ns means no significance found.

