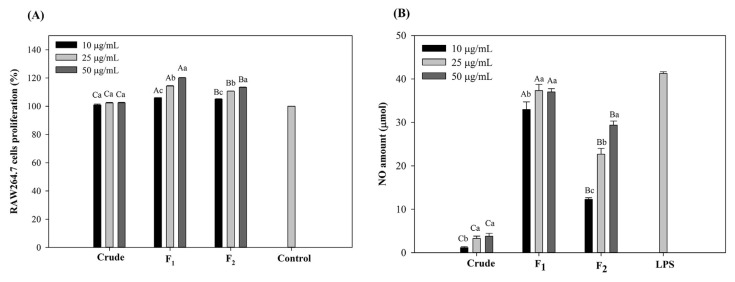
Fig. 4.
Proliferation activity (A) and nitric oxide production (B) of the RAW264.7 macrophage cells after treatment with crude and fractionated polysaccharides. The letters a, b, c, d indicate a significant difference (p < 0.05) between the concentrations of the polysaccharides, with A, B, C, D indicating a significant difference (p < 0.05) between the polysaccharides at each concentration.

