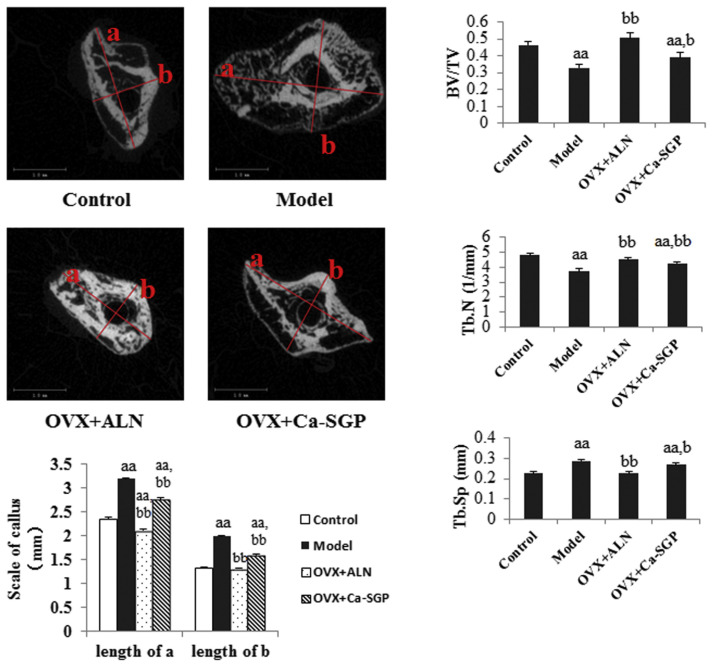
Fig. 5.
Micro-CT testing of the callus on day 24 post-surgery. After removal of soft tissues and the intramedullary pin, the collected tibiae were scanned by a micro-CT system at a voltage of 70 kV with a current of 114 μA. The scan range covered a distance between 3 mm proximal and 3 mm distal to the fracture line with a resolution of 10 μm and followed for the calculation of the following morphometric parameters: BV/TV, Tb.N and Tb.Sp. The transverse section of the callus obtained from 2D CT images was analyzed using ImageJ software. Data are presented as mean ± SD (n = 6 per group). Multiple comparisons were done using one way ANOVA analysis. aa P < 0.01 versus control group; b P < 0.05, bb P < 0.01 versus model group.

