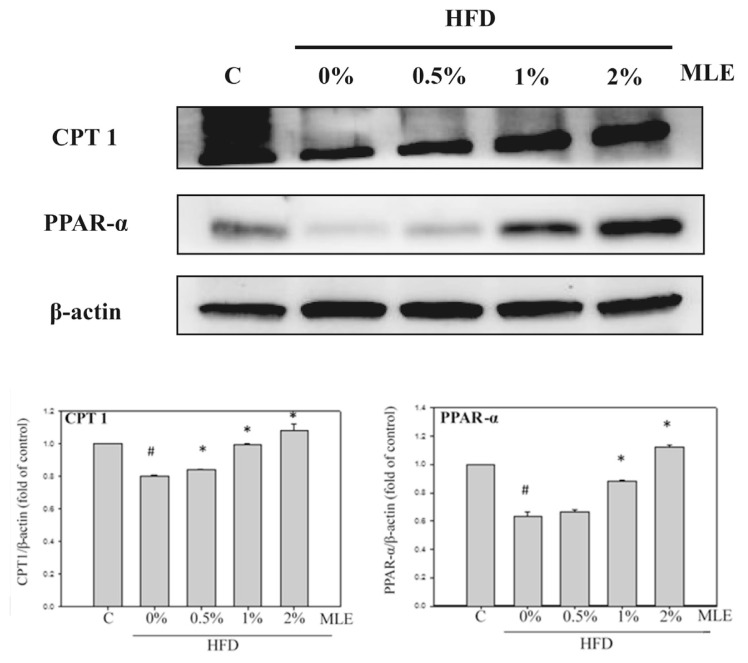
Fig. 4.
Effects of MLE on the lipolysis protein of liver. Rats were fed with different diets. After sacrifice, the liver protein was extracted. CPT-1, PPARα were analyzed with immunoblotting. Data was presented as the mean ± SD. #p < 0.05, ##p < 0.01, compared with the ND group. *p < 0.05, **p < 0.01 compared with the HFD group.

