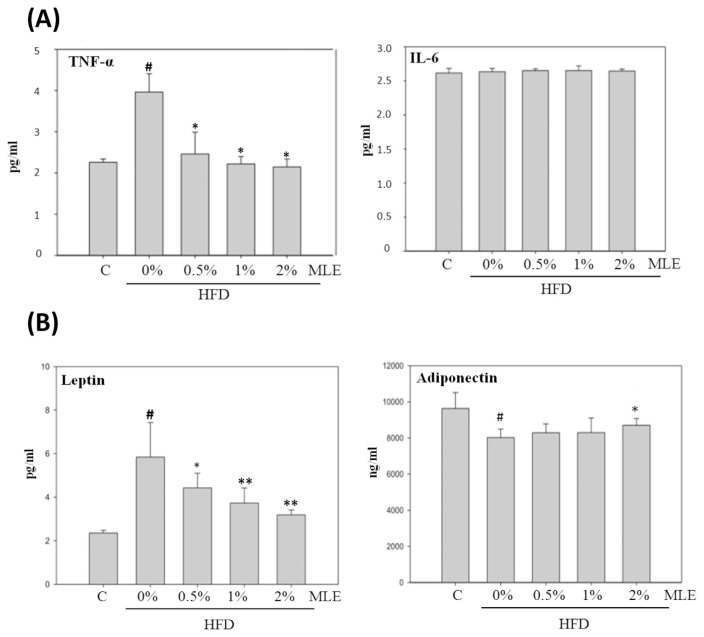
Fig. 6.
Effect of MLE on serum inflammatory cytokines (A) and adipokines (B). Rats were fed with different diets. After sacrifice, the serum was collected and analyzed with ELISA. Data was presented as the mean ± SD. #p < 0.05, ##p < 0.01, compared with the ND group. *p < 0.05, **p < 0.01 compared with the HFD group.

