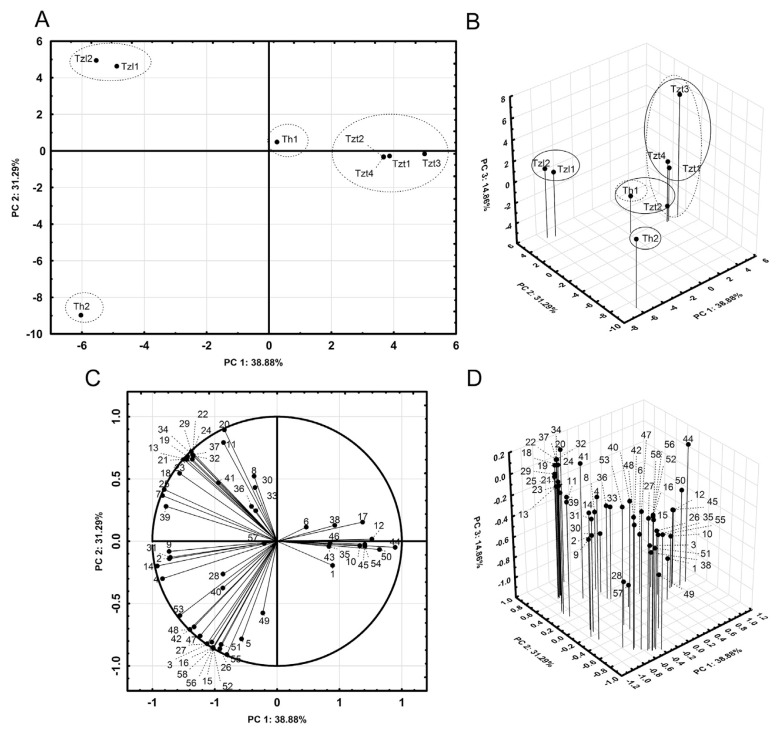
Fig. 1.
PCA score and loading plots. (A) Score plot of PC2 vs. PC1. (—) Tentative two-dimensional clustering. (B) 3D-score plot of PC3 vs. PC2 and PC1. (—) Tentative two-dimensional clustering. (−) Tentative three-dimensional clustering. (C) Loading plot of PC2 vs. PC1. (D) 3D-loading plot of PC3 vs. PC2 and PC1.

