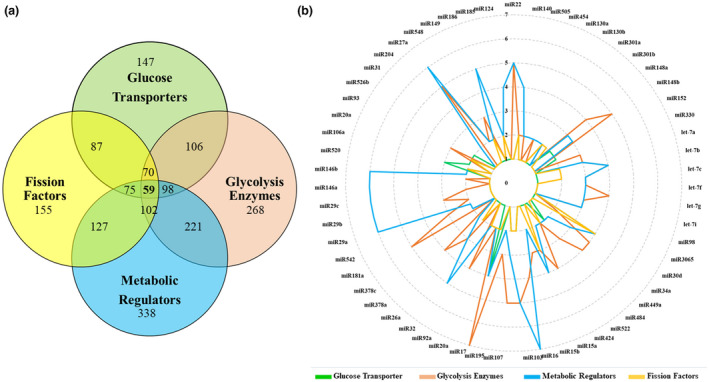
Figure 2.

Most of the identified miRNAs have shared targets. (a) The Venn diagram shows the number of miRNAs identified for each category of genes and the number of shared miRNAs between groups. (b) The radar chart illustrates the 59 miRNAs with at least one target gene in each group of genes. The circular lines represent the number of target genes that a miRNA is predicted to target in each category. TEFF cells have fragmented mitochondria that utilize glycolytic metabolism, while TN and TM cells have fused mitochondria which use OXPHOS to generate ATP. Therefore, miRNAs that target glycolytic enzymes might be under‐expressed in TEFF cells. To determine this, we looked at the miRNA profile expressed during TN → TEFF → TM stages of development based on published data. 75 , 79 , 115 A comparison of our identified miRNAs with the miRNA expression profile of each T cell subset found 12 miRNAs that are expressed at a low level in TEFF cells, whilst being upregulated in TM cells. These miRNAs have several targets among genes involved in glucose uptake, glycolysis and mitochondrial fission (Table 1).
