Fig. 1.

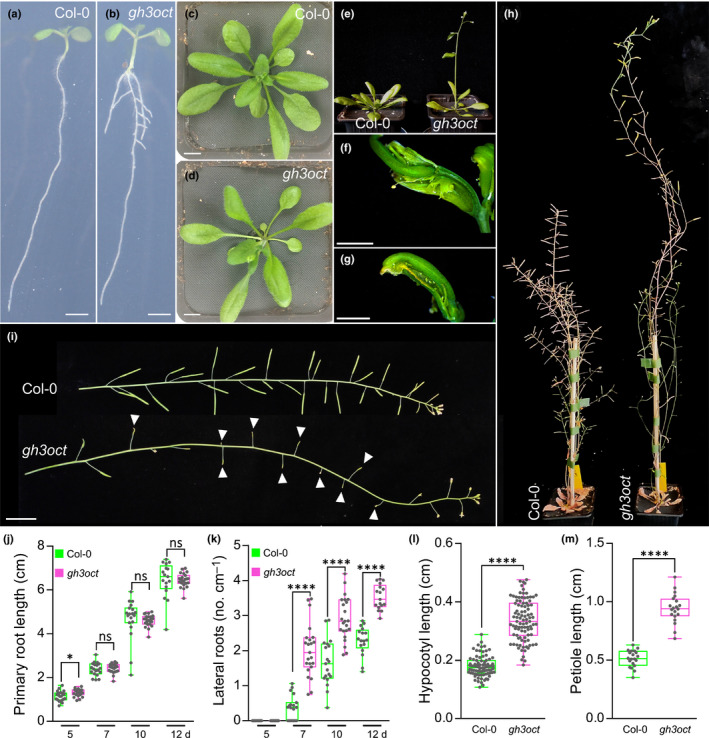
Phenotypes of the gh3oct mutant. (a–e) Arabidopsis thaliana Col‐0 and gh3oct plants at 7 (a, b), 20 (c, d) and 23 d (e) after stratification (das). (f, g) Aberrant reproductive structures occasionally formed by gh3oct mutant from latest inflorescences. (h) Plant height of Col‐0 and gh3oct flowering plants. (i) Stems from Col‐0 and the gh3oct mutant. White arrowheads indicate siliques that did not elongate further in the gh3oct mutant. (j, k) Primary root length (j) and lateral root density (k) determined at 5, 7, 10 and 12 das. (l) Hypocotyl length determined at 10 das. (m) Petiole length determined at 15 das. Box plots (j–m) showing the individual data points, the first and third quartiles (bottom and top of the box), the median (line in the box), and the highest (top whisker) and lowest (bottom whisker) values. Bars: (a, b) 2 mm; (c, d) 1 cm; (f, g) 2 mm; (i) 2 cm. Asterisks indicate values that are statistically different from Col‐0 in a two‐tailed Student’s t‐test (*, P < 0.05; ****, P < 0.0001; (j, k) n ≥ 17, (l) n ≥ 83, and (m) n = 20). ns, not statistically significant.
