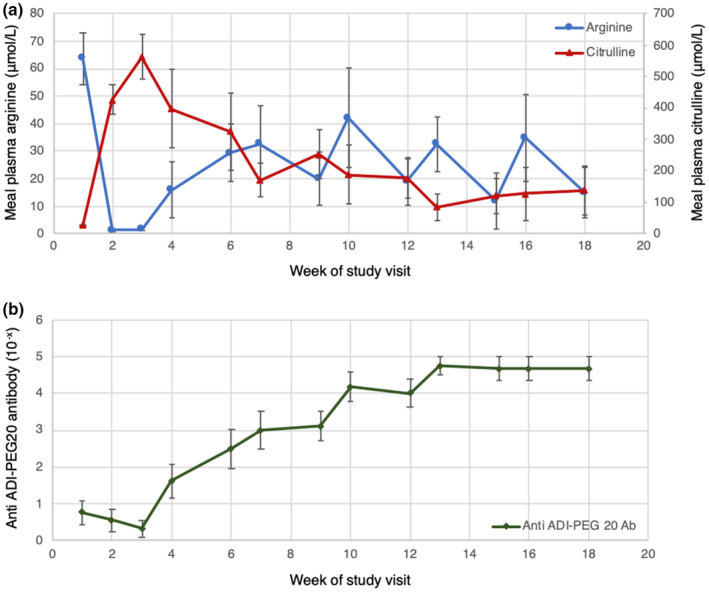
FIGURE 2.

(a) Mean plasma concentration of arginine and citrulline at each week of treatment for the study population. (b) Mean plasma anti‐ADI‐PEG20 antibody titres at each week of treatment for the study population. Error bars indicate the standard error of the mean (SEM). Ab, antibody; ADI‐PEG20, pegylated arginine deiminase
