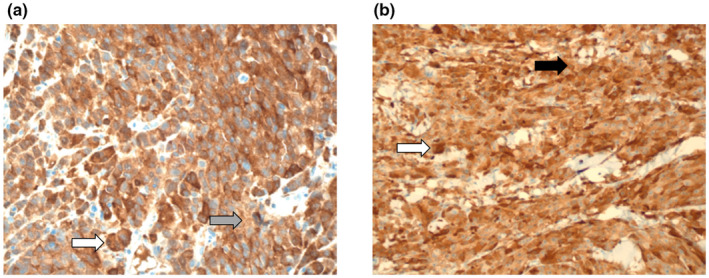
FIGURE 3.

Representative ASS1 tumoural expression at baseline (a, grey arrow, liver deposit with weak staining intensity) and at progression (b, black arrow, skin deposit with moderate‐strong staining intensity) in a patient with metastatic UM (×400). The larger strongly ASS1 expressing cells in the baseline and progression biopsies are consistent with macrophages (i.e. melanophages, white arrows)
