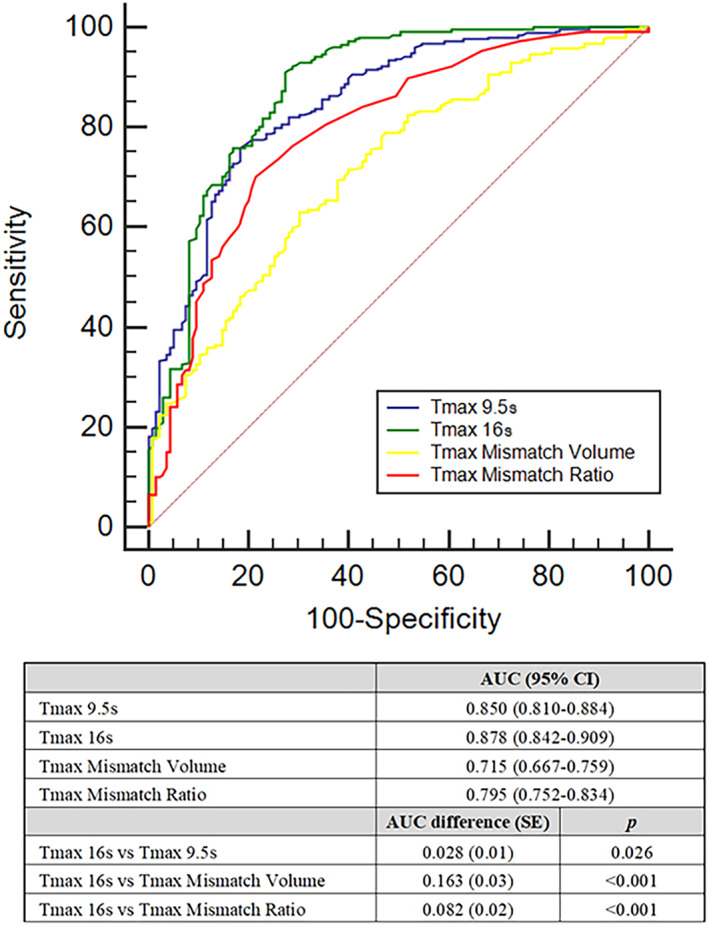
FIGURE 2.

Tmax volumes and Tmax mismatch ratio optimal values for recognizing patients with AIS with good clinical outcome as calculated using ROC curves. AIS = acute ischemic stroke; AUC = area under the curve; CI = confidence interval; ROC = Receiver Operating Characteristic; SE = standard error; Tmax = time to maximum concentration; Tmax 9.5 seconds, Tmax >9.5 seconds volume; Tmax 16 seconds, Tmax >16 seconds volume. AUC comparison was performed with DeLong test. Outcome of interest: modified Rankin Scale 0 to 2 at 90 days. [Color figure can be viewed at www.annalsofneurology.org]
