
FIGURE 3.
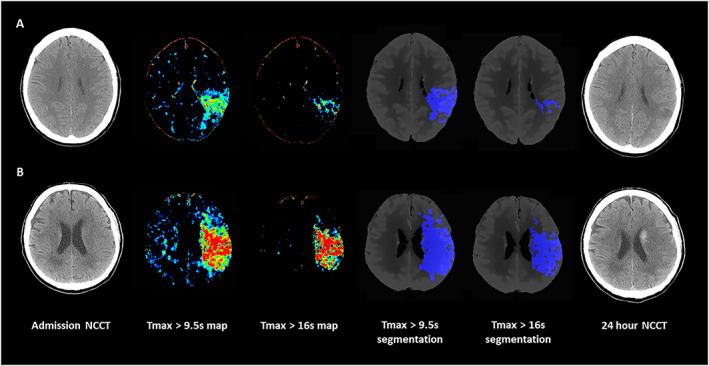
Tmax volumes in 2 patients with AIS and anterior circulation large vessel occlusion. Panel A: NCCT at admission, color coded CTP Tmax map with scale set at 9.6 to 25 seconds, Color coded CTP Tmax map with scale set at 16.1 to 25 seconds, Tmax > 9.5 seconds volume automatically segmented on CTP averaged images, Tmax > 16 seconds volume automatically segmented on CTP averaged images and NCCT at 24 hours in a 48 year‐old patient with AIS and ischemic lesion in left MCA territory who presented the following Tmax parameters: critically hypoperfused tissue = 39.5 ml; core volume = 8.7 ml; penumbra volume = 30.8 ml; and mismatch ratio = 4.5. FIV was 7.2 ml and mRS at 3 months was 0. Panel B: NCCT at admission, color coded CTP Tmax map with scale set at 9.6 to 25 seconds, Color coded CTP Tmax map with scale set at 16.1 to 25 seconds, Tmax >9.5 seconds volume automatically segmented on CTP averaged images, Tmax >16 seconds volume automatically segmented on CTP averaged images and NCCT at 24 hours with hemorrhagic transformation in a 67 year old patient with AIS and ischemic lesion in left MCA territory who presented the following Tmax parameters: critically hypoperfused tissue = 158.0 ml; core volume = 87.4 ml; penumbra volume = 70.6 ml; mismatch ratio = 1.8. FIV was 131.2 ml and mRS at 3 months was 4. AIS = acute ischemic stroke; CTP = computed tomography perfusion; FIV = final infarct volume; MCA = middle cerebral artery; mRS = modified Rankin Scale; NCCT = non‐contrast computed tomography; Tmax = time to maximum concentration. [Color figure can be viewed at www.annalsofneurology.org]