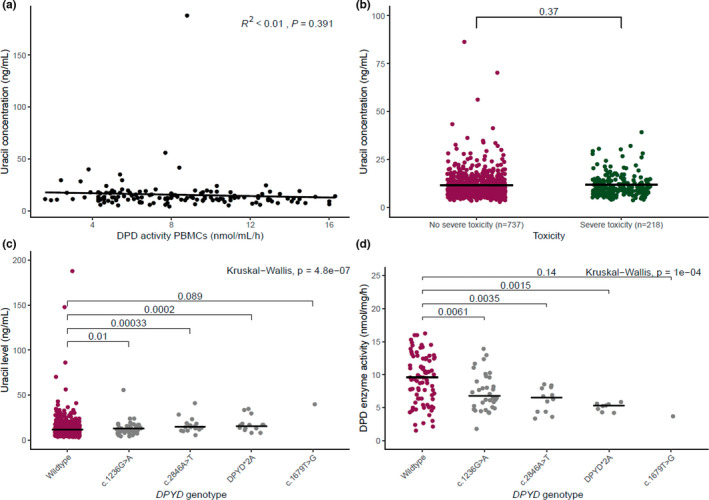
Figure 2.

Correlations of endogenous uracil levels, DPD enzyme activity in PBMCs, toxicity, and DPYD genotype. Dots represent individual results. Black lines represent the median of the data. (a) Shows the correlation between endogenous uracil levels and DPD activity. (b) Shows the endogenous uracil concentration in patients with and without severe toxicity. DPYD variants were excluded from the analysis as they received initial dose reductions based on their genotype results. (c) Shows the endogenous uracil levels in patients by DPYD‐genotype. (d) Shows the DPD enzyme activity measured in PBMCs of 138 patients (both DPYD variant carriers and wild type patients). DPD, dihydropyrimidine dehydrogenase; DPYD, gene encoding dihydropyrimidine dehydrogenase; NS, not significant; PBMCs, peripheral blood mononuclear cells; P value; vs, versus. [Colour figure can be viewed at wileyonlinelibrary.com]
