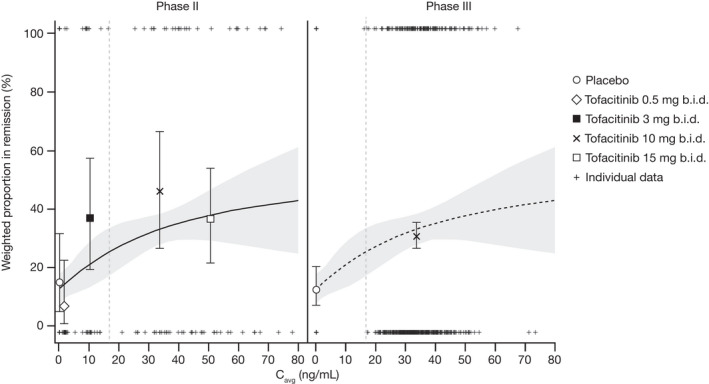
Figure 2.

Observed (symbols) and model predicted (solid line and shaded area) remission rate based on E‐R analysis of pooled phase II and phase III induction data in the subpopulation of patients without prior TNFi failure. Pooled data are displayed separately for phase II and phase III. The solid lines represent model‐predicted probability and the shaded areas represent the 95% CI. The vertical dashed lines indicate median Cavg for tofacitinib 5 mg b.i.d. (16.8 ng/mL), derived from the dose‐normalized, individual empirical Bayes estimates obtained from the population PK model. Observed probabilities by dose are plotted at the geometric mean of individual Cavg values at tofacitinib 0.5 mg b.i.d. (1.68 ng/mL), 3 mg b.i.d. (10.08 ng/mL), 10 mg b.i.d. (33.6 ng/mL), and 15 mg b.i.d. (50.4 ng/mL), error bars represent 95% CI. Cavg, average concentration during dosing interval; CI, confidence interval; E‐R, exposure‐response; PK, pharmacokinetic; TNFi, tumor necrosis factor inhibitor.
