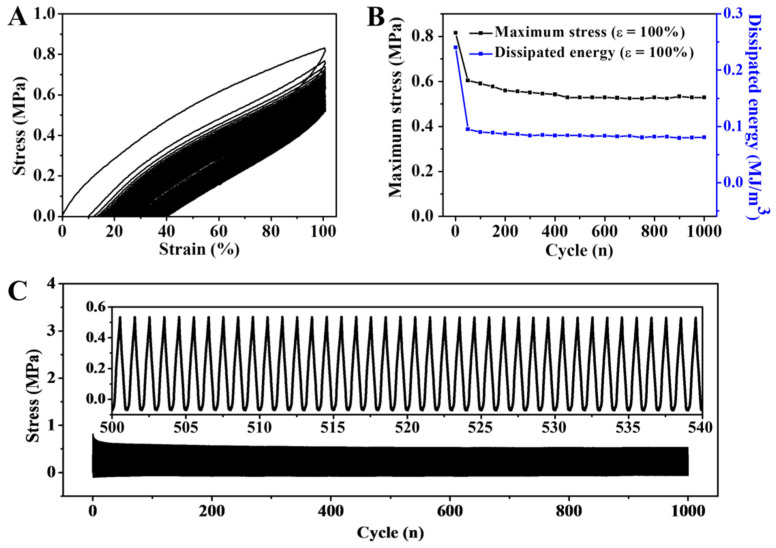
Figure 5.
(A) 1000 continuous elongation–relaxation cycles of the DN hydrogel. (B) The evolution of maximal stress and dissipated energy during 1000 cycles. (C) Real-time stress curve during a continuous 1000 cycles at a strain of 100%. The built-in figure was the stress curve during the 500th to 540th cycles.

