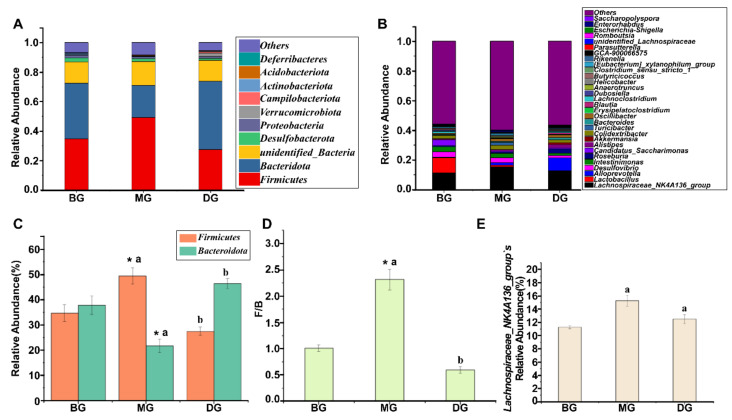
Figure 2.
Phylum and genus-level relative abundance. (A,C,D) Phylum horizontal relative abundance; (B,E) Genus horizontal relative abundance. * indicates significant difference between the means of the MG group and the BG group (p < 0.05), and the different lowercase superscript letters indicate that the means of the MG group and the DG group are statistically significant (p < 0.05). Data are presented as mean ± standard deviation, calculated from three replicates.

