Figure 2.

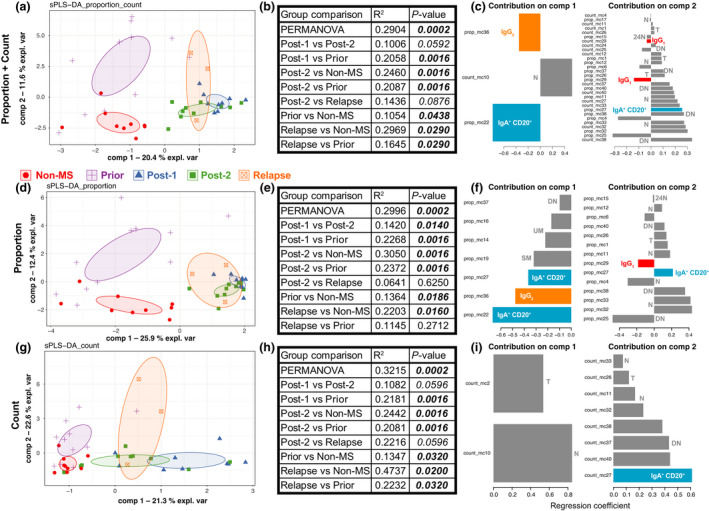
Overall B‐cell compartment differs between groups. FlowSOM clustering was done to first identify 40 metaclusters. The levels of each metacluster were calculated as proportion of B cells or counts for each patient. sPLS‐DA plots were generated to visualize differences between groups, using (a) proportion + count, (d) proportion or (g) count data. Each symbol represents an individual patient. Symbol and colors represent the group each patient belongs to. Ellipses are 95% confidence intervals. (b, e, h) A PERMANOVA was performed using the metaclusters identified by sPLS‐DA. Results for each comparison are shown in the relevant table. (c, f, i) The metaclusters used in the first two components of the sPLS‐DA are shown. The conventional B‐cell subset each metacluster belongs to is annotated. 24N, CD24hi naïve; DN, double negative; Ig, immunoglobulin; MS, multiple sclerosis; N, naïve; T, transitional; PERMANOVA, permutational multivariate analysis of variance; SM, switched memory; sPLS‐DA, sparse partial least squares‐discriminant analysis; UM, unswitched memory.
