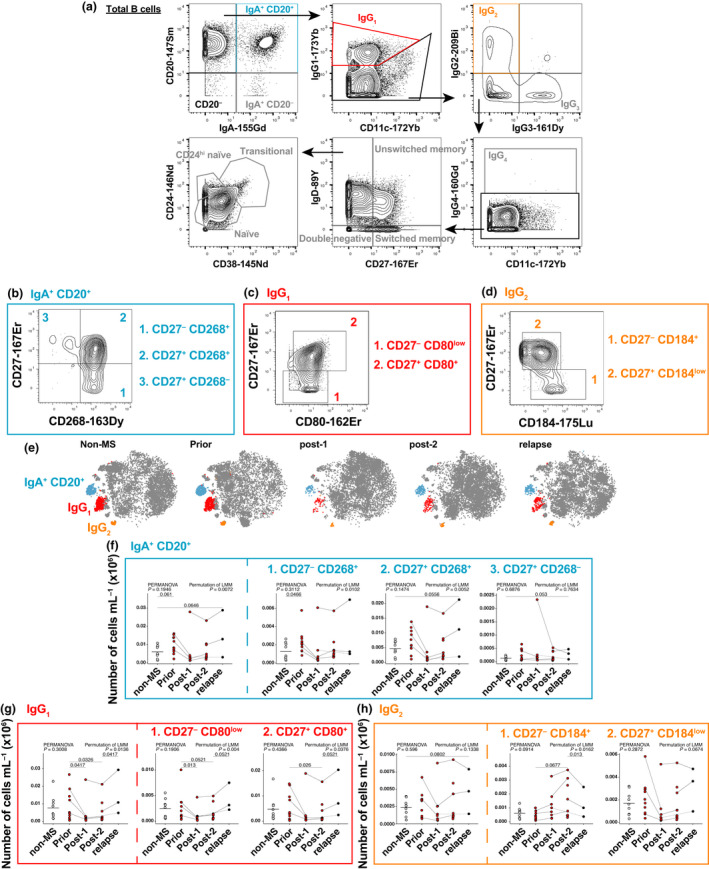
Figure 3.

IgA+CD20+, IgG1 + and IgG2 + B cells are affected by alemtuzumab treatment and associated with relapse. (a) Manual gating of conventional B‐cell subsets. CD27, CD80, CD184 and CD185 were used to further differentiate IgA+CD20+, IgG1 + and IgG2 + B‐cell subsets. Manual gating strategy of more defined (b) IgA+CD20+, (c) IgG1 + and (d) IgG2 + B‐cell subsets. Numbers represent least to most developed B‐cell subset within each subset. (e) FIt‐SNE plots represent B‐cell repertoire between groups. Blue cells are IgA+CD20+ B cells, red cells are IgG1 + B cells, and orange cells are IgG2 + B cells. All other B‐cell subsets are dark gray. Counts of (f) IgA+CD20+, (g) IgG1 + and (h) IgG2 + B cells (and their respective subsets) are shown as scatter plots. Solid lines signify data are available for adjacent timepoints, while dotted lines indicate patients with nonadjacent timepoints. For comparisons of B‐cell subset levels between all five groups [non‐MS controls (n = 9), patients with untreated MS (prior, n = 11) and patients with MS post‐1 (up to 12 months after alemtuzumab dose, n = 8), post‐2 (greater than 12 months, n = 10) alemtuzumab and relapse (n = 3)], a PERMANOVA was performed followed by pairwise comparisons with Holm’s correction. Prior, post‐2 and relapse groups were compared with non‐MS controls (for three comparisons). An LMM was calculated when comparing between patients with MS before and after treatment. A total of 4999 permutations were then run to calculate P‐values. Five multiple comparisons were made (prior to post‐1, post‐2 and relapse; and post‐1 to post‐2 and post‐2 to relapse) using a further 4999 permutations with Holm’s correction. The mean is shown in non‐MS controls, P‐values < 0.1 are shown. Ig, immunoglobulin; LMM, linear mixed‐effects model; MS, multiple sclerosis; PERMANOVA, permutational multivariate analysis of variance.
