Figure 2.

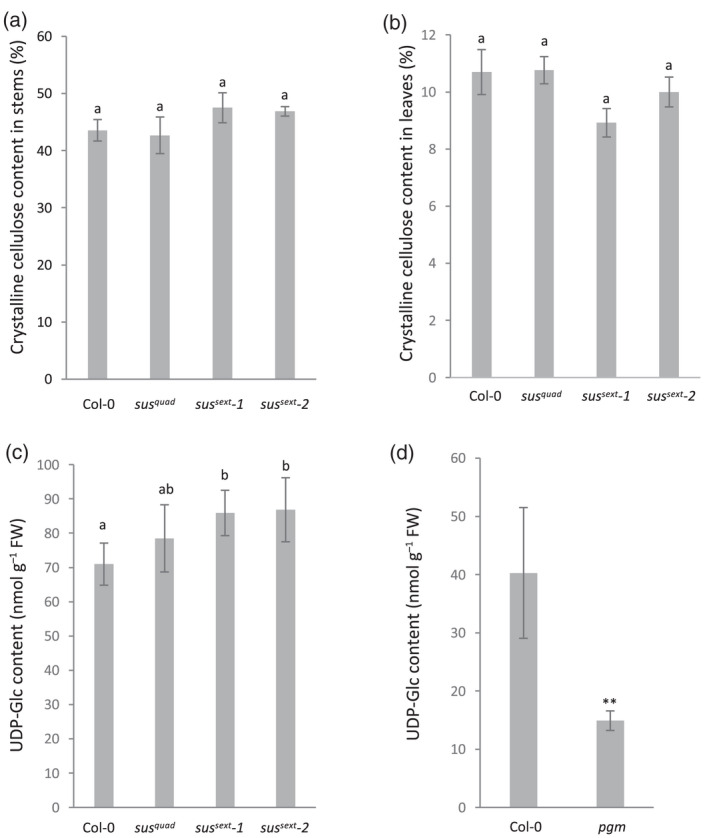
Cellulose and UDP‐glucose content in Arabidopsis sus mutants.
Crystalline (Updegraff) cellulose content in (a) stems of 10‐week‐old and (b) rosette leaves of Col‐0 and sus quad , sus sext ‐1, and sus sext ‐2. Values are means ± SE, n = 6 biological replicates.
(c) UDP‐glucose content in rosette leaves of Col‐0, sus quad , sus sext ‐1, and sus sext ‐2 in the middle of the day.
(d) UDP‐glucose content in rosette leaves of Col‐0 and pgm at the end of the night. **Student's t‐test, P < 0.01. Plants were grown in short days (8‐h light, 16‐h dark). Values are means ± SD, n = 5 biological replicates. One‐way ANOVA, post‐hoc Tukey HSD test. Different letters indicate significant differences (P < 0.05). UDP‐Glc, UDP‐glucose.
