

Abstract
RAB28 is a farnesylated, ciliary G‐protein. Patient variants in RAB28 are causative of autosomal recessive cone‐rod dystrophy (CRD), an inherited human blindness. In rodent and zebrafish models, the absence of Rab28 results in diminished dawn, photoreceptor, outer segment phagocytosis (OSP). Here, we demonstrate that Rab28 is also required for dusk peaks of OSP, but not for basal OSP levels. This study further elucidated the molecular mechanisms by which Rab28 controls OSP and inherited blindness. Proteomic profiling identified factors whose expression in the eye or whose expression at dawn and dusk peaks of OSP is dysregulated by loss of Rab28. Notably, transgenic overexpression of Rab28, solely in zebrafish cones, rescues the OSP defect in rab28 KO fish, suggesting rab28 gene replacement in cone photoreceptors is sufficient to regulate Rab28‐OSP. Rab28 loss also perturbs function of the visual cycle as retinoid levels of 11‐cRAL, 11cRP, and atRP are significantly reduced in larval and adult rab28 KO retinae (p < .05). These data give further understanding on the molecular mechanisms of RAB28‐associated CRD, highlighting roles of Rab28 in both peaks of OSP, in vitamin A metabolism and in retinoid recycling.
Keywords: bisretinoids, cilia, ciliopathy, cone‐rod dystrophy, outer segment, phagocytosis, Rab28, retinoids, visual cycle, zebrafish
Abbreviations
- cpd
cycles per degree
- CRD
cone‐rod dystrophy
- CT
circadian time
- dpf
days post fertilization
- IFT
intraflagellar transport
- mpf
months post fertilization
- OKR
optokinetic response
- OS
outer segment
- OSP
outer segment phagocytosis
- ZT
Zeitgeber time
1. INTRODUCTION
Visual impairment resulting from photoreceptor dystrophy is a common phenotype of inherited ciliopathies, a group of disorders characterized by ciliary dysfunction. The photoreceptor outer segment (OS) is a highly modified primary cilium. 1 , 2 As such, the OS is an intricate membranous organelle which detects light photons and converts them into neurotransmitter signals via phototransduction. 3 The molecular machinery required for normal ciliary formation, transport, and signaling is also required for photoreceptor OS development and function. 4
Rod OS discs appear to develop from nascent, evaginated, ciliary ectosomes whose shedding is blocked by peripherin. 4 While rod OS are comprised of enclosed discs, cone OS develop differently, forming open ended evaginations called lamellae. Both discs and lamellae are established via actin polymerization regulated by Arp2/3 and steadily shift toward the OS tip. 5 This continual process works in synergy with the highly regulated process of outer segment phagocytosis (OSP). As new OS discs and lamellae are continuously formed from evaginated ectosomes produced at the OS base, the oldest discs and lamellae are removed from the OS tip, and those are phagocytosed by the supporting retinal pigment epithelium (RPE). 6 The photoreceptor outer segment (POS) is exposed to high levels of light; thus, phagocytosis of the oldest OS tips by the RPE prevents the accumulation of photo‐oxidative compounds and maintains photoreceptor health and viability. 7
Outer segment phagocytosis deficits are directly linked to progressive forms of inherited blindness. 8 , 9 Defective OSP may also contribute to age‐related macular degeneration. 10 However, a large proportion of the molecular mechanisms instigating OSP in photoreceptors remain to be identified and characterized, leaving a knowledge gap in retinal biology and how perturbed OSP leads to retinal or macular degeneration. We consider OSP as a process encompassing demarcation of the OS area to be shed, overlapping with phagocytosis (consisting of three distinct phases, recognition/binding, internalization, and digestion). 11 Furthermore, OSP by the RPE is a putative alternative source of essential retinoids to integrate into the visual cycle, and support vision. ~7%–10% of distal OS are phagocytosed daily, providing a significant source of retinal following opsin proteolysis. 12 Discovery of ABCA4 expression in the RPE cells, in addition to photoreceptor disc membranes, provided strong evidence of an ABCA4 role to recycle this pool of free retinaldehyde via the visual cycle to prevent formation of toxic dimers (bisretinoids). 13 Previous studies also postulate that bisretinoids associated with the visual cycle could be transformed following phagocytosis in the acidic RPE phagolysosomes to A2E, the major lipofuscin fluorophore following phagocytosis in the acidic RPE phagolysosomes. 13 , 14 , 15 , 16 , 17
In 2012, the small ciliary GTPase Rab28 was identified as the first Rab GTPase associated with human cone‐rod dystrophy (CRD). RAB28 null and hypomorphic alleles cause autosomal recessive cone‐rod dystrophy (arCRD) with eight pathogenic alleles attributed to date. 18 , 19 , 20 , 21 , 22 , 23 In Caenorhabditis elegans, we have shown that Rab28 is an intraflagellar transport (IFT) and BBSome‐associated ciliary protein, 24 which regulates extracellular vesicle biogenesis in a subset of ciliated neurons. 25 In addition, we employed zebrafish knockout and transgenic reporter models to probe Rab28’s localization and, we previously described the localization, GTP/GDP nucleotide regulation, and a protein interactome of Rab28 in cone photoreceptors. Significantly, the rab28 KO zebrafish model shows a dawn OSP phenotype similar to the mouse rab28 KO model; however, no retinal degeneration was observed in the zebrafish model. 26 , 27
This study further investigated the role of Rab28 in the zebrafish retina, primarily focusing on its role in OSP. As the molecular mechanisms of cone OSP are insufficiently understood our aim was to elucidate regulators of OSP in zebrafish, a cone‐rich retina model, similar to humans. 28 At 15 days post fertilization (dpf), we investigated if rab28 KO zebrafish display reduced peak RPE phagosomes at both morning (ZT 4) and evening (ZT 17) OSP peaks, as described in Lewis et al. 29 We hypothesized that overexpression of Rab28 specifically in cone photoreceptors could rescue the OSP defect in rab28 KO fish, demonstrating a cell autonomous role. We undertook proteomic profiling by mass spectrometry to identify novel regulators of OSP regulators and factors dysregulated at OSP peaks by the loss of Rab28. Finally, we determined if visual cycle retinoid levels are significantly reduced in larval and adult rab28 KO eyes.
2. METHODS
2.1. Zebrafish strains and maintenance
Zebrafish larvae up to 131 hpf were grown in 10 cm dishes of E2 embryo medium (0.137 M NaCl, 5.4 mM KCl, 5.5 mM Na2HPO4, 0.44 mM KH2PO4, 1.3 mM CaCl2, 1.0 mM MgSO4, and 4.2 mM NaHCO3, conductivity ~1400–1600 µS, pH~7) maintained at 27°C in an incubator on a 14 h/10 h light‐dark cycle, unless otherwise stated. 30
Adult zebrafish were reared in 3 L/10 L tanks in system water and maintained at a temperature of 28°C on a 14 h/10 h light‐dark cycle unless otherwise stated. Up to 28 dpf, the adolescent zebrafish were fed a specialized diet (Special Diet Services) and were steadily transferred to a main diet of brine shrimp (Artemia sp.) and pellet food.
Zebrafish strains used in this study were as follows:
WT (Tübingen).
rab28ucd7
rab28ucd7Tg[gnat2:eGFP‐rab28WT]
rab28ucd7Tg[gnat2:eGFP‐rab28Q72L]
rab28ucd7Tg[gnat2:eGFP‐rab28T26N] 27
2.2. Ethics statement
All experiments with zebrafish were performed according to ethical exemptions and approvals granted by the UCD Animal Research Ethics Committee (AREC‐Kennedy 20‐15, 20‐16) and authorizations from the Health Products Regulatory Authority (Project authorization AE18982/P062 and AE18982/P187).
2.3. Zebrafish behavioral assays
The optokinetic response (OKR) assay to test visual acuity (VA) and contrast sensitivity (CS) of 5 dpf larvae, was initiated by placing larvae in 9% methylcellulose in a 55‐mm Petri dish. The dish was placed inside a rotating drum with a black‐and‐white striped pattern with 20%–100% contrast on the inside and 0.02–0.2 cycles per degree (cpd) grating spatial frequency, unless otherwise stated. 31 For VA assays, cpd grating spatial frequency was varied, whereas contrast remained at 100%. For CS assays, the cpd was consistently 0.02 cpd, with alterations made to contrast within the ranges highlighted above. The drum was rotated at 18 rpm for 30 s in a clockwise and 30 s in a counterclockwise direction. Using a stereoscope, eye movements (saccades) per minute were recorded manually. All visual behavioral measurements were performed in larvae at 5 dpf, prior to 131 hpf, between 10 a.m. (ZT 2.5) and 3 p.m. (ZT 7.5).
2.4. Electroretinogram
Electroretinogram (ERG) recordings were performed on juvenile zebrafish eyes 2 months post fertilization (mpf) as previously described. 32 In short, zebrafish were dark‐adapted for at least 30 min prior to testing, followed by euthanization. The eyes were stimulated with six light pulses (100 ms) with an intensity of 500, 2300, 6000, 6000, 2300, and 500 lux. Electrical signals were captured using an electrode that was inserted within the eyeball and subsequently amplified. The recorded maximum b wave amplitudes per zebrafish were averaged per light intensity and normalized against wild type. All statistical analyses were performed using PRISM software (v9.0.0). Average scores were calculated, followed by an unpaired student's t test.
2.5. Transmission electron microscopy
Zebrafish were humanely euthanized with tricaine methanesulfonate and stored in a 2% PFA and 2.5% glutaraldehyde in 0.1 M Sorenson phosphate buffer pH 7.3 fixative solution at 4°C for a minimum of 2 days. Sample processing involved post‐fixation in 1% osmium tetroxide and subsequent dehydration using a 4‐day gradient of ascending series of ethanol concentrations prior to Epon 812 resin for a minimum of 24 h. 80 nm sections were cut on a Leica EM UC6 microtome and mounted on copper grids and post‐stained with 2% uranyl acetate and 3% lead citrate. To ensure consistency between samples for imaging and quantitative analysis, the optic nerve was used as a reference point for sectioning. Imaging was performed on an FEI Tecnai 120 electron microscope. For phagosome analysis by TEM, phagosomes were manually counted, and the density was calculated as phagosomes per micron of RPE as previously described. 27
2.6. Retinoid analysis
For retinoid analysis carried out on adult zebrafish, two fish per strain were euthanized in tricaine (MS‐222) prior to enucleation on ice under dim red light (four eyes per genotype, per replicate). Samples were snap frozen in liquid nitrogen and stored at −80°C. Analysis of larval retinoid levels were carried out on 100 larval heads per strain as previously described. 33 Subsequent to euthanasia, larval heads were collected under dim red light on dry ice and snap frozen in liquid nitrogen and stored at −80°C. For normal‐phase high‐performance liquid chromatography (HPLC) analysis of retinoids, all retinoid extractions were carried out under dim red light in a dark room. Four zebrafish eyes (adult) or 100 heads (larval) were stored at −80°C, thawed on ice, and homogenized in 500 μl of phosphate‐buffered saline (PBS) using a glass tissue grinder (Kontes). Protein concentration was determined using 50 μl of sample and a Micro BCA protein assay kit (Pierce). To the remaining 450 μl of homogenate, 25 μl of 5% SDS (~0.2% SDS final concentration) and 50 μl of brine were added, and samples were briefly mixed. Hydroxylamine hydrochloride (500 μl of 1.0 m solution in pH 7.0 PBS) was added to generate retinal oxime, and samples were vortexed and incubated at room temperature for 15 min. The aqueous phase was quenched and diluted using 2 ml of cold methanol. The samples were twice extracted by the addition of 2‐ml aliquots of hexane, brief vortexing, and centrifugation at 3000 g for 5 min to separate the phases. Pooled hexane extracts were added to 13 × 100‐mm borosilicate test tubes and evaporated to dryness under a stream of nitrogen. Dried samples were dissolved in 100 μl of hexane and analyzed by normal‐phase HPLC using an Agilent 1100 series chromatograph equipped with a Supelcosil LC‐Si column (4.6 × 250 mm, 5 μm) using a 0.2%–10% dioxane gradient in hexane at a flow rate of 2 ml per min. The eluted mobile phase was analyzed using a photodiode‐array detector. Spectra (210–450 nm) were acquired for all eluted peaks. The identity of eluted peaks was established by comparison with spectra and elution times of known authentic retinoid standards. Retinoid amounts were quantitated by comparing their respective peak areas to calibration curves established with retinoid standards.
2.7. Bisretinoid analysis
For bisretinoid analysis carried out on adult zebrafish, three fish per strain were euthanized in tricaine (MS‐222) prior to eye dissection on ice under dim red light. Samples were snap frozen in liquid nitrogen and stored at −80°C. Animals had been dark adapted for 12 h prior to euthanasia. Bisretinoids were extracted from zebrafish eyes under red dim light. Briefly, six zebrafish eyes per each biological sample were washed with PBS and homogenized in 1 ml PBS. Chloroform/methanol (4 ml, 2:1, vol/vol) was added, and the samples were extracted with the addition of 4 ml of chloroform and 3 mL of dH2O, followed by centrifugation at 1000 g for 10 min. Extraction was repeated with the addition of 4 ml of chloroform. Organic phases were pooled, filtered, dried under a stream of argon, and redissolved in 100 μl of 2‐propanol. Bisretinoid extracts were analyzed by normal‐phase HPLC with a silica column (Zorbax‐Sil 5 μm, 250 × 4.6 mm; Agilent Technologies) as previously described in Radu et al (IOVS 2008). 34 The identity of each bisretinoid peak was confirmed by online spectral analysis. A2PE data were presented as means with standard deviation of four biological samples for each genotype.
2.8. Statistical analysis
Statistical analysis of all data was performed using Graphpad Prism v7, unless otherwise stated. All data values shown represent the mean for the number of replicates (n) indicated in each figure legend. Error bars represent standard errors of the mean (SEM) or standard deviations (SD), as indicated. Student's t test or an anova was used to determine the statistical significance between groups, where indicated. Statistical analysis of all data for Figures 6 and 7 was performed using R, unless otherwise stated. The boxplots in Figure 6(D–F) illustrate the minimum and maximum values (ends of the whiskers), interquartile range (length of the box), and median (line through the box) for the three replicates at each time‐point ZT 4, ZT 9, and ZT 17. A one‐way repeated‐measures anova was used to determine if there was a statistically significant difference in the mean across time (i.e., for ZT 4, ZT 9, and ZT 17). Then a student's t test was used to perform pairwise comparisons to examine if there is a statistically significant difference in the mean for the following pairs: ZT 4 relative to ZT 9; ZT 9 relative to ZT 17; and ZT 4 relative to ZT 17. Using the results from the t test Figure 6(G) shows the number of proteins that are upregulated or downregulated at a specific time‐point in comparison with all other time points. Figure 6(H) shows the mean of the seven proteins that were downregulated at time‐point 9 at each time‐point ZT 4, ZT 9, and ZT 17; the difference in the mean and its upper and lower confidence interval for ZT 4 relative to ZT 9 and ZT 9 relative to ZT 17.
FIGURE 6.

Investigation into internal regulators of zebrafish outer segment phagocytosis (OSP). (A) Time course highlighting sample collection time (red x) in relation to phagosome‐level fluctuation (B) Heat map representing differentially expressed proteins between 2 months post fertilization wild‐type siblings at ZT 4, ZT 9, and ZT 17, respectively, illustrating proteins significantly upregulated (in red) or downregulated (in green), given a cut‐off of −log p‐value ≥1.3. Student's t test was used for statistical analysis. (C) Gene ontology analysis of significantly downregulated and upregulated proteins at OSP peaks (ZT 4 and ZT 17 grouped) compared with an OSP trough (ZT 9). (D–F) Box and whisker plots showing the normalized expression profile of known OSP‐associated proteins Itgav, Lamp1b, and Abcf1 at ZT 4, ZT 9, and ZT 17. (G) Table containing the number of proteins that are specifically upregulated or downregulated at ZT 4, ZT 17, or ZT 9. (H) Table documenting the mean of the seven proteins specifically downregulated at the OSP trough (ZT 9) compared with OSP peaks (ZT 4 and ZT‐17); the difference in the mean and the upper and lower confidence intervals for ZT 4 relative to ZT 9 or ZT 9 relative to ZT 17.
FIGURE 7.

Investigation into outer segment phagocytosis (OSP) regulators in rab28 KO retinae (A) Time course highlighting sample collection time (red x) in relation to phagosome level fluctuation (B) Heat map representing differentially expressed proteins at ZT 4, ZT 9, or ZT 17 in 2 months post fertilization rab28 KO illustrating proteins significantly upregulated (in red) or downregulated (in green), given a –log p‐value cut‐off of ≥1.3. Student's t test was used for statistical analysis. (C) Table of 21 proteins derived from the 52 candidate OSP regulators (Figure 6) that have a statistically significant interaction, indicating that for these proteins, the relationships between group (rab28 KO vs. sibling) and log‐transformed LFQ intensity depends on Zeitgeiber time (ZT 4, ZT 9, and ZT 17) as determined by a two‐way anova. (D) Table of 21 candidate OSP regulators disrupted in rab28 KO documenting in more detail the specific time points altered. The difference in the log‐transformed LFQ intensity between the rab28 KO and sibling group, their corresponding lower and upper confidence intervals (LCI and HCI) and the p‐value indicating if this difference is significant at each time point respectively is shown. Colored boxes indicate when the p‐value for the pairwise t test determines that there is a statistically significant difference between log‐transformed LFQ intensity for rab28 KO versus sibling; orange‐ ZT 4 and ZT 17, yellow‐ ZT 4, blue ZT 9, green‐ZT 17. (E–I) Box and whisker plots showing the log‐transformed LFQ intensity of the known OSP‐associated proteins Calreticulin, Rab7a, Dynamin‐1‐like protein, Parkinson disease protein 7 and Rp2 at ZT 4, ZT 9 and ZT 17, highlighting significant differences between wild‐type siblings (sibling) and rab28 KO (mutant) at specific time points
For proteomic profiling of OSP regulators as described in Figure 7, a two‐way repeated‐measures anova was carried out to examine the effect of group type (Mutant or Sibling) over time (ZT 4, ZT 9, and ZT 17) on log‐transformed LFQ intensity. There was a statistically significant interaction between the effects of group and time on LFQ intensity for the proteins listed in Figure 7(C). This implies that the trend of the log‐transformed LFQ intensity over time was significantly different if the individuals were rab28 mutant versus sibling for these proteins. Some examples of proteins with significantly different trends over time are illustrated in Figure 7(E–I). Subsequently, pairwise t tests were used to determine if there was a statistically significant difference in the mean of the log‐transformed LFQ intensity for rab28 mutant versus sibling at each time point. Figure 7(D) provides the list of proteins that show a significant difference in LFQ intensity for at least one‐time point. All p‐values were adjusted using the Bonferroni multiple testing correction method. If the p < .05, it is highlighted in the Table in Figure 7(D). Normality checks and Levene's test were carried out, and the assumptions were met.
2.9. Proteomic analysis
Two animals were euthanized per genotype at each time point with three biological replicates per time point (four eyes per genotype, per replicate, per time point). Eyes were dissected on ice and snap frozen in liquid nitrogen with 1× protease inhibitor (Roche) in milliQ H2O. Protein concentrations were determined using the BCA protein assay kit (ThermoFisher Scientific). Samples were stored at −80°C until protein preparation processing using PreOmics iST Sample Preparation Kit (PREOMICS) as per manual (https://www.preomics.com/resources). Samples were analyzed on a Thermo Scientific Q‐Exactive mass spectrometer connected to a Dionex Ultimate 3000 (RSLCnano) chromatography system. Peptides were separated on C18 home‐made column (C18RP Reposil‐Pur, 100 × 0.075 mm × 3 μm) over 150 min at a flow rate of 250 nl/min with a linear gradient of increasing ACN from 1% to 27%. The mass spectrometer was operated in data‐dependent mode; a high resolution (70 000) MS scan (300–1600 m/z) was performed to select the 12 most intense ions and fragmented using high‐energy C‐trap dissociation for MS/MS analysis.
2.10. Data processing and bioinformatics
Raw data from the Q‐Exactive were processed using MaxQuant 35 , 36 (version 1.6.4.0) incorporating the Andromeda search engine (ANDROMEDA). To identify peptides and proteins, MS/MS spectra were matched against Uniprot Danio rerio database (2018_05) containing 46 933 entries. All searches were performed using the default setting of MaxQuant, with trypsin as specified enzyme allowing two missed cleavages and a false discovery rate of 1% on the peptide and protein level. The database searches were performed with carbamidomethyl (C) as fixed modification and acetylation (protein N terminus) and oxidation (M) as variable modifications. For the generation of label‐free quantitative (LFQ) ion intensities for protein profiles, signals of corresponding peptides in different nano‐HPLC MS/MS runs were matched by MaxQuant in a maximum time window of 1 min. 37 The Perseus computational platform (version 1.6.2.3) was used to process MaxQuant results. 38 Data were log transformed. To examine changes in protein expression using volcano plots, data were log transformed, and missing values were imputed with values from a normal distribution. Data were normalized using z‐score and visualized using heat maps. Pathway enrichment analysis was performed using the ClueGo (v2.3.5) 39 and Cluepedia (v1.3.5) plugins 40 in Cytoscape (v3.4.0) 41 with the Danio rerio (7955) marker set. The KEGG functional pathway databases, consisting of 6004 genes, as well as the Gene Ontology biological processes database with 17 136 genes were used 42 GO tree levels (min = 3; max = 8) and GO term restriction (min#genes = 3, min% = 1%) were set, and terms were grouped using a kappa score threshold of 0.4. The classification was performed by the right‐sided hypergeometric enrichment test, and its probability value was corrected by the Benjamini–Hochberg (adjusted % term p < .05).
3. RESULTS
3.1. Proteome profiling reveals cellular pathways regulated by Rab28
To elucidate the biological effects of Rab28 loss on the zebrafish retina, an unbiased proteomic profiling approach was undertaken, comparing eyes of a rab28 KO model to wild‐type siblings. To capture changes in protein expression at peaks and troughs of OSP, biological triplicates were collected at ZT 4, ZT 9, and ZT 17 (Figure 1A). From 2 mpf eyes, a total of 4112 proteins were identified in rab28 KO and wild‐type sibling samples by mass spectrometry. 498, 310, and 207 proteins were significantly altered (−log p‐value ≥1.3) in rab28 KO eyes at ZT 4, ZT 9, and ZT 17, respectively. The data presented in heat maps (Figure 1B–D) show 325, 208, and 71 upregulated proteins and 173, 102, and 136 downregulated proteins at ZT 4, ZT 9, and ZT 17, respectively, in rab28 KO. Volcano plots generated with stringent cut‐offs of ±1.2 fold change and −log p‐value ≥1.3, highlighted the most downregulated ocular proteins observed in the rab28 KO to include BBSome and collagen family proteins (Figure 1E–G). The most upregulated proteins include small nuclear ribonucleoproteins and vitellogenins (Figure 1E–G). Venn diagrams represent proteins which show similar and mutually exclusive upregulation/downregulation in the rab28 KO compared with wild‐type sibling control (Figure 1H,I). Notably only five proteins were significantly, differentially expressed at all time points. The three proteins upregulated at the three distinct time points in rab28 KO were 40S ribosomal protein S21, Myosin heavy chain 11a, Smooth muscle and Tubulin alpha chain 5. Two proteins were downregulated; unannotated si:ch211‐186e20.2, predicted to be a serine‐type endopeptidase inhibitor and Dihydropyrimidinase‐like 5b. Notably, the largest number (297 + 156) of uniquely altered proteins occurs at ZT 4, the morning OSP peak, in rab28 KO. There are 51 + 114 uniquely altered proteins at ZT 17 in rab28 KO. There is only a small number (5 + 7) of proteins uniquely altered at both OSP peaks.
FIGURE 1.
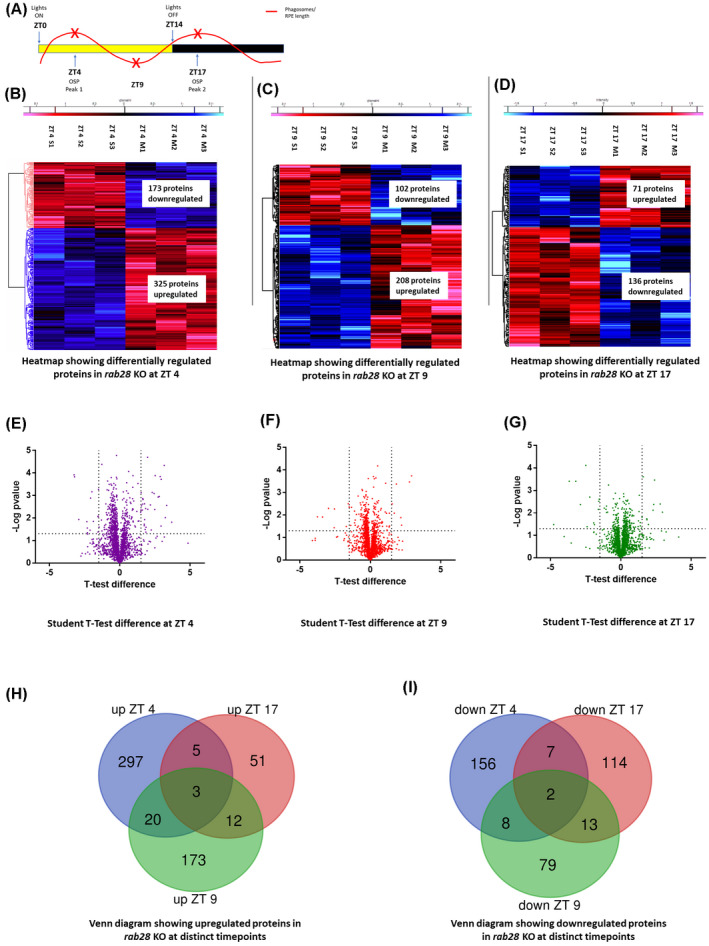
rab28 knockout zebrafish have altered proteome profiles (A) Time course highlighting sample collection time (red x) in relation to phagosome level fluctuation. (B–D) Heat maps representing the differentially expressed proteins between 2 months post fertilization wild‐type siblings and rab28 −/− at ZT 4, ZT 9 and ZT 17 respectively, illustrating proteins significantly upregulated (in red) or downregulated (in blue), given a cut‐off of −log p‐value ≥1.3. Student's t test was used for statistical analysis (N = 3). (E–G) Volcano plot representing differentially expressed proteins between wild‐type siblings and rab28 −/− given a fold change cut‐off of ±1.2 and −log p‐value ≥1.3. Student's t test was used for statistical analysis. (H,I) Venn diagram representing common and mutually exclusive proteins upregulated (H) and downregulated (I) between rab28 KO and wild‐type siblings at ZT 4, ZT 9, and ZT 17
To identify cellular processes and pathways altered as a consequence of Rab28 loss, KEGG analysis of the significantly, differentially expressed proteins identified phototransduction (e.g., short‐wave opsin), phagocytosis (e.g., Tubb1, Tubb2, Atp6v1) and oxidative phosphorylation pathways (e.g., Ndufs6, Ndufb7) altered at ZT 4, ZT 9, and ZT 17 (Figure 2A–C).
FIGURE 2.
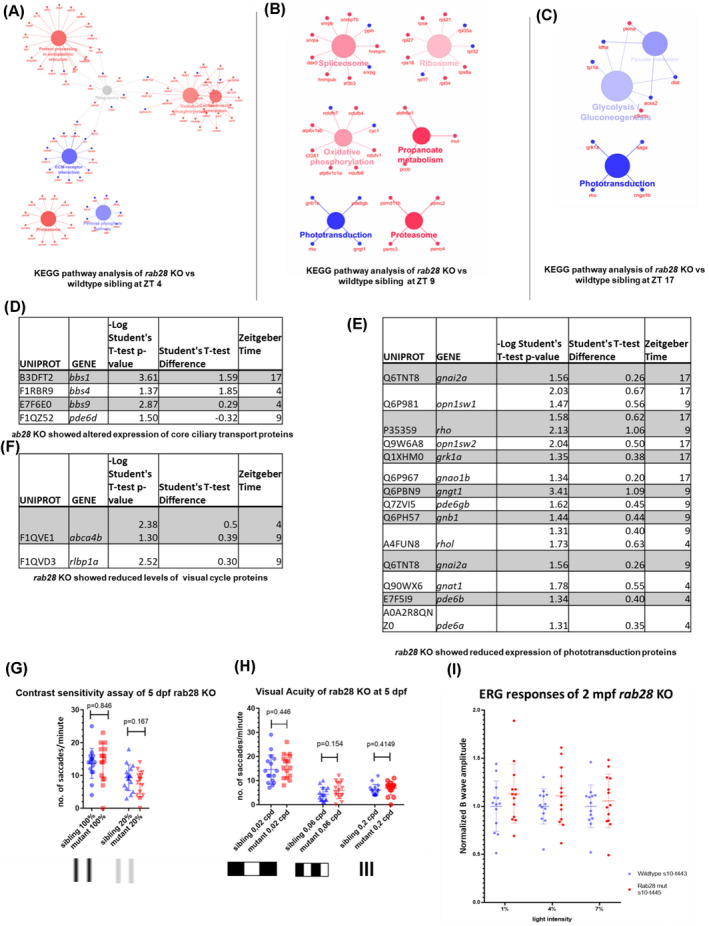
Pathway analysis of the altered protein profile of rab28 KO shows reduced levels of core ciliary trafficking and phototransduction components (A–C) KEGG pathway analysis of significantly downregulated (blue) and upregulated (red) proteins in rab28 −/− compared with wild‐type siblings at outer segment phagocytosis peaks and trough (D–F) Tables describing significantly downregulated and upregulated proteins associated with core ciliary trafficking components (D), phototransduction (E) and the visual cycle (F), respectively. Statistical analysis was carried out using a student's t test. (G) Scatter plot of visual behavior‐based contrast sensitivity of rab28 −/− larvae at 5 days post fertilization (dpf). Data are from three independent replicates. At least 16 larvae were tested per genotype for each assay. (H) Scatter plot of visual behavior‐based visual acuity of rab28 −/− larvae at 5 dpf. rab28 KO larvae do not show any reduction in visual acuity compared with sibling control when tested at 0.02, 0.06 or 0.2 cpd, analyzed using a student's t test. Data are from three independent replicates, analyzed using a student's t test. (I) Normalized ERG b‐wave amplitudes recorded in rab28 KO at 2 months post fertilization show no significant difference compared with ERG‐traces from wild‐type controls (n = 12, n = 13), statistical analysis was carried out using a student's t test
Further interrogation of our proteomic data shows significantly reduced expression of core ciliary transport proteins, for example, Bbs1, Bbs4, and Bbs9 in rab28 KO eyes (Figure 2D). This is in agreement with our previous research which showed a link between Rab28 and the BBSome complex, an octameric protein complex necessary for protein trafficking into and out of the cilium. 25 We also observed increased Pde6d levels in the rab28 KO at ZT 9, which is interesting as Pde6d is the molecular chaperone known to shuttle lipidated Rab28 into the cilium by a trafficking pathway known as lipidated protein intraflagellar targeting (LIFT). 25 , 26 , 27
Previously, we reported that rab28 KO larvae did not show an impaired visual phenotype up to 15 dpf using the OKR assay under standard conditions. 27 However, as the proteomic analysis revealed reduced levels of phototransduction and visual cycle proteins (e.g., Short‐wavelength opsin 1 and 2, Rhodopsin, and Cellular retinaldehyde‐binding protein 1) (Figure 2E,F) in 2 mpf rab28 KO eyes, we re‐investigated vision using more sensitive visual behavior methods (Figure 2G,H). 31 These assays probed for defects in CS or VA (Figure 2G,H). However, in rab28 KO larvae at 5 dpf, no significant differences in either the VA or CS were observed compared with control siblings. ERG data collected at 2 mpf also did not reveal a significant difference in the normalized b‐wave amplitude of the rab28 KO compared with the age‐matched wild‐type sibling control, suggesting there is no reduction in retinal function in rab28 KO at juvenile stages (Figure 2I). The absence of an impaired visual/retinal phenotype at the larval‐juvenile stages indicates that Rab28 function is compensated for by other proteins or that impaired vision is a mid‐late‐onset phenotype.
Our proteomic analysis of the rab28 KO model revealed a significant reduction in the levels of Abca4b (Figure 2F), a fish paralogue of the gene encoding ABCA4; a member of the ATP‐binding cassette transporter gene sub‐family A (ABC1). ABCA4 defects are associated with recessive Stargardt's disease. 43 In retinal photoreceptors, ABCA4 actively flips N‐retinylidene‐phosphatidylethanolamine from the lumen to the cytoplasmic leaflet of OS membranes, thereby facilitating the removal of potentially toxic retinoid compounds from photoreceptors. 44 , 45 Recently, ABCA4 was shown to be expressed in the RPE, aiding in recycling of free retinaldehyde released during proteolysis of opsins following OSP, thereby attenuating formation of bisretinoids in the RPE. 13
3.2. Rab28 loss results in reduced RPE phagosomes at both zebrafish OSP peaks
In the context of OSP, we previously reported 55% lower levels of phagosomes in the RPE of rab28 KO at ZT 4, 27 the dawn OSP peak. 29 This concurred with similar reports for a Rab28 KO mouse model. 26 However, different species display one, two, or potentially even three OSP peaks. 29 , 46 , 47 The zebrafish retina has two OSP peaks; a dawn peak at ZT 4 and a dusk peak at ZT 17, comprising of phagocytosed cone and rod photoreceptor OS tips at each time‐point. 29 From the proteomic data, KEGG pathway analysis revealed the phagosome pathway to be altered in the rab28 KO at ZT 4 (Figure 2A). Although individual phagocytosis‐associated proteins were altered at ZT 4, ZT 9, and ZT 17, the term phagocytosis did not reappear in the KEGG pathway analysis at time points other than ZT 4. Thus, to directly assess the integrity of OSP in the rab28 KO throughout the day, samples were collected at discrete time points in accordance with the OSP flux reported. 29 As in Carter et al, 27 TEM was performed on the retinae of 15 dpf rab28 KO and siblings but extended to ZT 0, ZT 4, ZT 12, and ZT 17 and the number of RPE phagosomes counted. As expected, the phagosome number oscillated between time points (Figure 3B). Importantly, the TEM analysis ascertained that loss of Rab28 also disrupts the dusk OSP peak reducing the peak number of overall RPE phagosomes by ~50% compared with the sibling controls. TEM of additional time points confirmed the rab28 KO line does not display phase‐shifted peaks at ZT 0 or ZT 12 (Figure 3B–N). Notably, there is a basal level of RPE phagosomes (46% of the peak phagosome number, when comparing ZT 4 vs. ZT 0) observed at each time‐point in both wild‐type siblings and rab28 KO (Figure 3B). This reveals that Rab28 is required for the burst of RPE phagosomes at dawn and dusk peaks, but not for basal levels of OSP.
FIGURE 3.

rab28 knockout zebrafish have reduced levels of retinal pigment epithelium (RPE) phagosomes, at 2 known outer segment phagocytosis peaks. (A) Time course highlighting sample collection time (red x) in relation to phagosome level fluctuation. (B) Trend line demonstrating the level of RPE phagosomes present in rab28 KO (red) compared with sibling controls (blue) at defined time points throughout the day. (C–J) Representative TEM images of rab28 sibling controls and KO retinae at 15 days post fertilization, with phagosomes indicated (pink arrows). Scale bar; 2 μm, (K–N) Scatter plots of phagosome/μm of RPE in rab28 sibling and KO retinas at distinct time points. rab28 KO fish have ~55% reduction in OS engulfed RPE phagosomes in comparison with sibling controls at ZT 4 and ZT 17. Statistical analysis carried out using an unpaired student's t test for each distinct time point. RPE of >350 μm was analyzed per animal. N = 6 retinae per genotype at ZT 4 and ZT 17, N = 2 retinae per genotype at ZT 0 and ZT 12
3.3. Reduced RPE phagosomes caused by loss of Rab28 is rescued using cone‐specific eGFP:Rab28
In the retina, Rab28 is expressed in the RPE, and rod and cone photoreceptors. 26 , 48 We hypothesized that the reduced RPE phagosomes at OSP peaks in rab28 KO zebrafish resulted from the absence of Rab28 in cones. Thus, a Tol2 Rab28‐eGFP transgene, expressing EGFP‐tagged zebrafish Rab28, regulated by a cone‐specific gnat2 promoter 49 was crossed into the rab28 KO line. TEM sections were collected from transgenic animals at the dawn OSP peak, and the number of RPE phagosomes quantified (Figure 4). This revealed that gene replacement to selectively express wild‐type zebrafish Rab28 in cone photoreceptors is sufficient to restore the dawn OSP peak in rab28 KOs to wild‐type levels (Figure 4B,E), suggesting zebrafish Rab28 plays a more important role in cone photoreceptors compared with other retinal cells.
FIGURE 4.

rab28 knockout zebrafish have reduced levels of retinal pigment epithelium (RPE) phagosomes containing OS, which can be rescued using cone‐specific expression of eGFP; Rab28 (A) Time course highlighting sample collection time (red x) in relation to RPE phagosome numbers. (B) Scatter plots of phagosome/μm of RPE in rab28 sibling, KO, and eGFP‐Rab28 variants in the KO background. rab28 KO fish have ~55% reduction in RPE phagosomes containing engulfed OS material in comparison with sibling controls. rab28 KO expressing Tg(eGFP:Rab28WT,QL,TN) rescue this phenotype and do not show reduced numbers of RPE phagosomes containing engulfed OS shed material. Statistical analysis was performed using a one‐way anova, followed by a Bonferroni multiple comparison test. Error bars show SEM. N = 3 animals per genotype. (C–G) Representative TEM images of rab28 sibling control, KO and KO expressing Tg(eGFP:Rab28WT,TN, QL) retinae at 15 days post fertilization, with phagosomes indicated (pink arrows). Scale bar; 2 μm. RPE of >350 μm was analyzed per animal.
GTPase switching between the GTP, or GDP‐bound conformations of Rabs is the major mechanism by which most Rabs are thought to be activated/inactivated. 50 We previously reported that both GTP and GDP‐binding variants of zebrafish Rab28 localize to the photoreceptor OS, albeit to varying degrees. 27 While Rab28 localizes to the cone OS independent of nucleotide binding, it is unknown if the role of Rab28 in OSP is influenced by nucleotide binding. This question was investigated with three eGFP‐Rab28 variants expressed in zebrafish cones in the rab28 KO background. Surprisingly, both GTP‐preferring and GDP‐preferring transgenic models restored normal peak levels of RPE phagosomes in the knockout background (Figure 4B,E–G). Notably, the Rab28T26N variant was recently reported as pathogenic in CRD patients. 19 A slight reduction in RPE phagosomes was observed in the eGFP‐Rab28T26N retinas, however, this was not statistically significant (Figure 4B,F). We also observed an increase in the amount of RPE phagosomes with eGFP‐Rab28Q72L in comparison with the wild‐type variant, albeit again this difference did not show statistical significance (Figure 4B,G).
3.4. Investigation into light regulation of zebrafish OSP
To inform future studies of OSP regulation in zebrafish, the issue of whether the peaks show a circadian regulation, as in mice and rats, 46 , 51 , 52 or a light‐dark transition regulation as in frogs 47 needed to be resolved. Thus, the effect of a dark‐dark light cycle on RPE phagosomes was quantified by TEM at ZT 4, ZT 9, and ZT 17 (Figure 5). With dark:dark environmental conditions, the number of RPE phagosomes at circadian time 4 (CT4) (0.12 phagosomes/μm RPE) and CT 17 (0.10 phagosomes/μm RPE) was significantly (p =.005, p ≤ .0001 respectively) reduced (Figure 5F,H,I,J) compared with both peak numbers (0.18 and 0.25 phagosomes/um RPE, respectively) at ZT4 and ZT 17, under a normal light dark cycle (Figure 5B,D,I,J) suggesting an absence of circadian regulation. Indeed, at both CT 4 and CT 17, in the absence of light, the number of RPE phagosomes was equivalent to the basal number (0.14 phagosomes/μm RPE) present at OSP trough time ZT 9 (Figure 5C,I,J). Notably, RPE phagosomes were not eliminated in the dark:dark samples but maintained at a level equivalent to the basal level at an OSP trough in light‐dark reared samples (Figure 5I,J ). In summary, exposure to light:dark transition was necessary to fully initiate the burst of OSP at the expected dawn and dusk peak time in the zebrafish retina.
FIGURE 5.

Zebrafish outer segment phagocytosis (OSP) is regulated by external light sources. (A,E) Time course highlighting sample collection time (red x), and light‐dark cycle. Samples were collected at ZT 4, ZT 9, and ZT 17 from 16 days post fertilization (dpf) wild‐type zebrafish retinae. At each time point, one cohort had undergone a regular 14:10 light:dark cycle. The other had been raised in dark from ZT 10 the day prior to collection and were euthanized under red light. (B–D, G,H) Representative TEM images of wild‐type retinae at 16 dpf, with phagosomes indicated (pink arrows). Scale bar; 5 μm. (I) Scatter plots of phagosome/μm of retinal pigment epithelium (RPE) in dark‐reared and control retinas at ZT 4 and ZT 17 (OSP peaks) and ZT 9 (OSP trough). Fish raised in the dark for have ~35%–55% reductions in the number of RPE phagosomes containing engulfed OS material in comparison with controls at ZT 4 and ZT 17 respectively. Statistical analysis carried out by student's t test between individual groups. RPE of >570 μm was measured per animal. N = 3 animals (6 retinae) per group per time point. (J) Trend line demonstrating the level of RPE phagosomes present in the dark‐raised wild‐type eyes (black) compared with controls exposed to the regular light‐dark cycle (orange) at defined time points throughout the day. A two‐way anova, followed by Turkey's multiple comparison testing revealed no significant difference between CT 4 CT 9 or CT 17 (black), but a significant difference between ZT 4 versus ZT 9 (p = .0229), ZT 9 versus ZT 17 (p ≤ .0001), and ZT 4 versus ZT 17 (p = .003) (orange)
3.5. Proteomic analysis of wild‐type zebrafish retinae reveals potential OSP regulators
Significant progress has been made in identifying factors that mediate phagocytosis of rod OS in the RPE. 53 , 54 , 55 However, our understanding of the factors (e.g., in photoreceptors) that initiate OSP is limited, as is whether OSP is regulated by the same factors at dawn and dusk peaks. To probe these research questions, proteins with significant changes in expression between peaks and troughs of OSP were identified from proteomic profiling of wild‐type zebrafish eyes collected at ZT 4, ZT 9 and ZT 17 (Figure 6A,B). Cross comparisons of all three time points identified 676 proteins with significant changes between peak‐to‐trough or peak‐to‐peak (Figure 6B). Gene ontology analysis identified the cellular processes of intracellular transport and cellular protein localization (e.g., Rab2a, Rab3ab, and Dkc10) as differentially expressed at the dawn and dusk OSP peaks compared with the OSP trough (Figure 6C). To assess the quality of this novel list of differentially expressed proteins during OSP, we examined the profile of canonical OSP proteins (Figure 6D–F). Encouragingly, Integrin alpha‐V (Itgav) and ATP binding cassette subfamily F member 1 (Abcf1) peaked at the dusk OSP peak ZT 17. Lysosomal‐associated membrane protein 1b (Lamp1b) stayed constant throughout the day, despite high variability between biological replicates at ZT 17 (Figure 6E). Using a more stringent analysis of changes in the pattern of expression, 52 proteins were significantly differentially expressed at the dawn and/or dusk OSP peaks compared with the OSP trough (Figure 6G,H, Table S1). Two and sixteen proteins were uniquely upregulated at ZT 4 and ZT 17, respectively. Twelve and fifteen proteins were uniquely downregulated at ZT 4 and ZT 17, respectively. No proteins were significantly downregulated at both OSP peaks compared with the OSP trough. Notably, seven proteins were significantly upregulated at both the dawn and dusk OSP peaks compared with the OSP trough (ZT 4 and ZT 17 vs. ZT 9) (Figure 6G,H). These proteins include Jacalin 8, Sorting nexin 6, Dyskerin, Calpain 2, N‐myc downstream‐regulated 1b, Exportin 1 and an unannotated 6.8 kDa mitochondrial proteolipid like protein (Figure 6H). Details on proteins significantly altered at solely one OSP peak are listed in Table S1. Most (7 of 9) of the proteins upregulated at ZT 4 are also upregulated at ZT 17, whereas only 7 of the 23 proteins upregulated at ZT 17 are also upregulated at ZT 4. There is no overlap between the proteins downregulated at ZT 4 and ZT 17. Further investigation is required to elucidate the precise roles, if any, of these proteins in OSP regulation, and at which stage of the OSP process they are involved; demarcation, recognition, binding, engulfment, or degradation. In summary, our analysis has uncovered novel proteins potentially involved in regulating OSP in vivo. In particular, as the zebrafish is a cone‐dominant model, some of these candidate proteins may be specifically important for cone photoreceptor OSP.
3.6. Identification of potential OSP regulators with modified expression profiles in rab28 KO retinae
Given the list of 52 proteins identified as significantly altered at one/both OSP peaks, we took the opportunity to discriminate how Rab28 could regulate OSP, by determining which of these 52 proteins display significantly altered expression patterns in the rab28 KO model (Figure 7A,B). For a substanial cohort of proteins, two‐way anova revealed the linear trend of the log‐transformed LFQ intensity over time was significantly different between rab28 mutant versus sibling. Of the original 52 candidate OSP proteins, 21 showed a significant profile difference in the rab28 KO eyes compared with sibling controls (Figure 7C). Several were previously associated with OSP, or general phagocytic processes including Rab7a and Tuba1a. A deeper analysis was undertaken to determine if there was a statistically significant difference in the mean of the log‐transformed LFQ intensity for rab28 mutant versus sibling at distinct time points (Figure 7D). In line with Rab28’s role in OSP, the 21 candidates were predominantly proteins showing significantly altered levels at a single OSP peak time point, either ZT 4 or ZT 17. The profiles of Acat2, Septin 3, Lsm4, Calr3b, Crabp2b, Ncaldb, and Camk2b1 showed a significant simple main effect alteration at ZT 4 (e.g., Figure 7E). In contrast, Calb2a, Nploc4, Gpr37l1b, Rab7a, Cryba1l1, and Tuba1a showed a significant simple main effect alteration in the rab28 KO at ZT 17 (e.g., Figure 7F). Only one protein profile, Dnml1l, was significantly different at ZT 9 (Figure 7G). Uniquely, the protein profile of Park7, an oxidative stress sensor previously associated with macrophage phagocytosis 56 is altered at both OSP peaks in the rab28 KO compared with wild‐type controls (Figure 7H).
Additionally, Rp2 (p = .016) and Polr2c (p = .04) displayed a significant difference in the mean log‐transformed LFQ intensity for rab28 mutant versus sibling, but there is no significant association with time (ZT 4, ZT 9, and ZT 17; see Figure 7(I) for an illustration).
3.7. rab28 gene knockout leads to age‐dependent changes of visual cycle retinoid and bisretinoid levels
Defective phagocytosis of photoreceptor OS by the RPE is linked to diminished health and function of the eye in some inherited retinal dystrophies and in age‐related blindness 9 , 10 , 57 Therefore, we investigated if there were functional consequences in retinal homeostasis due to the loss of OSP peaks in rab28 KOs. The light‐sensitive chromophore 11‐cis‐retinaldehyde (11cRAL) is needed for phototransduction and is recycled from its all‐trans‐retinaldehyde (atRAL) photoisomer via the RPE visual cycle. OSP by the RPE generates a pool of retinaldehyde to shuttle either into the visual cycle as atRAL or being directly recycled as 11cRAL to photoreceptors. 12 , 13
Hence, we hypothesized that Rab28 loss would affect levels of visual cycle retinoids and bisretinoids. Eyes were collected under dark‐adapted conditions from rab28 +/+ and rab28 KO eyes at larval (15 dpf) and adult (8 mpf) stages, and the retinoid profile was evaluated by HPLC.
At 15 dpf, a significant reduction in the rab28 KO levels of retinyl esters; 11‐cis‐retinyl palmitate (11cRP) (p = .0127) and all‐trans‐retinyl palmitate (atRP) (p = .0306) was observed (Figure 8A). At 8 mpf, a significant reduction in the visual chromophore 11cRAL (p = .0110), atRP (p = .0313), and total cumulative retinoids was observed (Figure 8B). From these data, we infer a direct or indirect role of Rab28 in the visual cycle, with the reduction in 11cRAL potentially leading to a visual deficit at a later time point. At the 8 mpf time point, we noticed a trend towards increasing levels of atRAL, a precursor of bisretinoid biogenesis and a marked reduction in total retinoid content.
FIGURE 8.
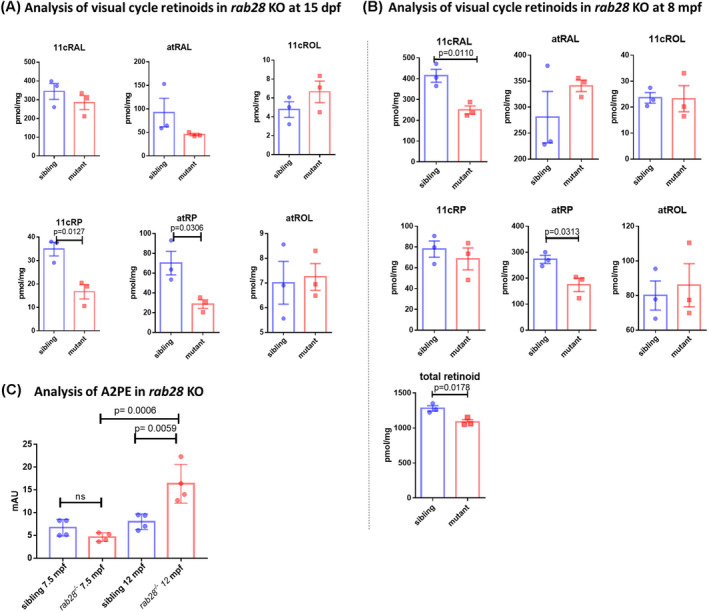
rab28 KO zebrafish eyes show a reduced level of total retinoids and retinyl esters at 15 days post fertilization (dpf) with an additional reduction in levels of the visual chromophore 11‐cis‐retinal at 8 months post fertilization (mpf). (A) Retinoid profiles of 15 dpf rab28 KO zebrafish eyes and sibling controls were analyzed using normal phase high‐performance liquid chromatography (HPLC). Bars represent the mean ± SD of three independent experiments for each genotype with 100 heads per biological replicate. rab28 KO mutant eyes showed significantly reduced levels of 11‐cis‐retinyl palmitate (p = .0127), all‐trans‐retinyl palmitate (p = .0306) compared with sibling controls (B) Retinoid profiles of 8 mpf rab28 KO zebrafish eyes and sibling controls were analyzed using HPLC. Bars represent the mean ± SD of three independent experiments for each genotype with four eyes per biological replicate. rab28 KO eyes show significantly reduced levels of 11‐cis‐retinal (p = .0110), all‐trans‐retinyl palmitate (p = .0313) compared with sibling controls. rab28 KO eyes also show a significantly reduced level of total retinoid (p = .0178). (C) Bisretinoid profiling by HPLC reveal a significant increase (p = .0059) in the levels of A2PE in the rab28 KO compared with wild‐type sibling controls at 1 year old. Bars represent the mean ± SD of A2PE expressed as milli absorbance units (mAU); six eyes per biological replicate (n = 4) were analyzed for each genotype. Data were analyzed by unpaired, two‐tailed t tests
Thus, we investigate whether rab28 KO zebrafish show changes in vitamin A dimerization processes which materialize as accumulation of bisretinoid‐lipofuscin in RPE cells. Bisretinoids are a family of photoreactive vitamin A aldehyde‐derived adducts that form nonenzymatically as a by‐product of the visual cycle and implicated in disease processes that threaten vision and retinal health. 58 We quantified bisretinoids by normal‐phase HPLC in dark‐adapted rab28 +/+ and rab28 KO eyes at 7.5 and 12 mpf (Figure 8C). Levels of A2E, a major bisretinoid found in the lipofuscin granules, were similar in the zebrafish eye irrespective of genotype and age (data not shown). However, the levels of the A2PE bisretinoid, an immediate precursor of A2E, 16 were significantly (p = .0059) increased in eyes of 12 mpf rab28 KO compared with wild‐type zebrafish eyes (Figure 8C). There was no difference in A2PE levels at 7.5 mpf, (Figure 8B) suggesting the rate of bisretinoid by‐product formation is augmented by age.
4. DISCUSSION
Since linkage of human RAB28 mutations to inherited blindness and cone‐rod dystrophy, studies have focused on Rab28 function in the retina. However, there remains a vast gap in understanding of the protein networks regulated by Rab28. Here, we endeavored to bridge that void, to shed more light on Rab28 function and Rab28‐CRD disease mechanisms. This study uncovered that Rab28 is required from the larval zebrafish stage for the burst of RPE phagocytosis, of the photoreceptor outer segments at both dawn and dusk peaks. We further investigated the regulation of OSP in the zebrafish model and the role of Rab28. Using a gene complementation approach, we uncovered that Rab28 plays an important role in the cone photoreceptors, as cone‐specific expression of Rab28 was sufficient to restore the OSP defect in our knockout model. Proteomic analysis by mass spectrometry demonstrates loss of Rab28 effects the expression profile of several known regulators of OSP and identified potential novel regulators of the OSP process. We determined that rab28 KO can result in long‐term physiological effects on the retina, as retinoid and bisretinoid analysis on the rab28 KO revealed altered levels of visual cycle components, as well as an increase in the toxic vitamin A compound A2PE.
Our proteomic analysis demonstrates that when Rab28 expression is ablated at adult stages, expression levels of several protein families are significantly reduced, including those of ciliary transport proteins, the visual cycle and phototransduction (Figure 2). In agreement, previous studies in ciliated C. elegans cells show that prenylated Rab28 is an IFT cargo, associating with the molecular transport trains in a GTP‐dependent manner. 24 Furthermore, Rab28 was dependent on the BBSome for localization to the ciliary membrane, and on the molecular chaperone Pde6d for transport into the cilium. 24 , 25 The interaction of Rab28 and Pde6d has been confirmed in mouse and zebrafish retinae. 26 , 27 Indeed, Ying et al 26 suggested that visual impairment in Pde6d mouse knockouts relates to Rab28’s absence from photoreceptor OSs. The rodent study saw no changes in the expression levels of Pde6d in the Rab28 KO’s. Here, we have observed a small, but significant increase in the levels of Pde6d in the rab28 KO model at 2 mpf at ZT 9, which could potentially be an attempt at compensation for reduced Rab28 levels.
In relation to ciliary transport, we also observed a significant reduction in the levels of BBSome proteins Bbs1, Bbs4, and Bbs9 at ZT 4 or ZT 17, in zebrafish rab28 KO eyes (Figure 2D). This suggests that Rab28 loss has a consequential effect on the BBSome, a finding not previously reported at the protein level. Previous work shows that the C. elegans orthologue of BBS‐8 is required for ciliary localization of Rab28. 25 Based on available evidence, Rab28 is postulated not to be a member of the core BBSome complex but rather associated with the BBSome to undergo IFT within the cilium. 24 As such, further investigation in needed into how loss of an IFT and LIFT cargo could reduce protein levels of trafficking machinery.
At 2 months of age, many components of cone and rod phototransduction were significantly reduced in Rab28 KO eyes which could lead to impaired vision. Previously, Carter et al 27 used the standard OKR and visual motor response assays to assess the visual behavior of the rab28 KO model up to 21 dpf, which showed no reduction in visual function compared with siblings. Thus, we adapted our OKR assay, allowing investigation of more subtle defects in VA or CS. 31 However, in 5 dpf rab28 KO larvae, no deficit was observed in VA or CS (Figure 2H,I). We conclude that rab28 KO larvae do not have an early‐onset vision impairment and that assays in adult rab28 KOs are most likely to uncover impaired vision consistent with reduced phototransduction proteins at 2 months.
As mouse and zebrafish Rab28 KOs display diminished dawn OSP peaks, we expected proteomic analysis to reveal significant changes in phagocytosis related proteins. However, from KEGG pathway analysis the phagocytosis pathway as a whole was only downregulated at ZT 4, but with individual OSP associated proteins significantly altered at the latter time points (Figure 2A–C). To independently expand on the findings from Carter et al27, we quantified the number of RPE phagosomes present at consecutive time points in 15 dpf rab28 KO retinae. This revealed that OSP peaks were not time shifted in the rab28 KO and confirmed that Rab28 is required for the peak levels of OSP at dawn and dusk. Strikingly, this broader temporal analysis of OSP peaks and troughs, revealed significant basal levels of RPE phagosomes throughout the day. Notably, the basal levels of OSP were not altered in rab28 KO, suggesting that Rab28 is required for the burst of OSP that occurs at dawn and dusk peaks (Figure 3). Similar results are observed in the αvβ5 and anxa5 mouse knockout models, wherein absence of either protein causes a complete lack of the characteristic burst of phagocytosis. 8 , 59 In these models, there is a higher basal level of phagocytosis throughout the day which may compensate for the reduced peaks. 8 , 59 This may happen in rab28 KO models and could explain why rapid retinal degeneration is not observed. Likewise, the avB5 KO shows no defect in visual behavior until beyond 4 months and in the RPE of older αvβ5 mice accumulation of autofluorescent lipids occurs. 8 Thus, chronic defects in OSP may be needed before visual impairment presents.
Here, we demonstrate that Rab28 expressed in cone photoreceptors is sufficient to rescue the defect in peak OSP observed in rab28 KO. This indicates that Rab28 in cone photoreceptors has a cell‐autonomous role in regulating OSP peaks. Previous studies suggest that OSP requires a synergistic relationship between photoreceptors and the RPE, but that RPE proteins were the key regulators for efficient OS tip engulfment and removal. 6 , 11 However, our data suggest that Rab28 expressed in the cone photoreceptors is necessary to enable peaks of OSP. Similarly, genetic mutants of kif17 show reduced levels of RPE phagosomes throughout the day. 29 Kif17 shows rhythmic expression, localizing to the cone OS tip at both OSP peaks, suggesting that cone expressed Kif17 also regulates OSP. Clearly, OSP is not merely a passive process for photoreceptors, but one which requires an interplay between RPE‐ and photoreceptor‐specific regulators.
When wild‐type eGFP‐tagged Rab28 was returned solely to cone photoreceptors, this was sufficient to restore peak RPE phagosomes, to wild‐type sibling levels (Figure 4). To ask if this effect was dependent on Rab nucleotide binding, we expressed dominant negative and dominant active transgene variants in the rab28 KO. Surprisingly, given drastic phenotypic differences between these variants in C. elegans, both GDP‐locked and GTP‐locked expressing lines were also capable of rescuing the peak OSP phenotype in the null model. These data agree with previous immunofluorescence data suggesting that zebrafish Rab28 is a non‐canonical Rab in its behavior and function. 27 Notably, the recently reported Rab28T26N variant reported in a CRD family showed normal peak levels of OSP in the null background. 19 Although a slight reduction in RPE phagosomes was observed in the “nucleotide empty” eGFP‐Rab28T26N retinas compared with wild‐type siblings, this was not statistically significant (Figure 4B,F). One possible reason for these differences is the T26N variant in our transgenic model may be GDP‐preferring rather than GDP‐locking, or may have some low level of normal Rab28 activity is preserved, which could mask a potential severe phenotype. Alternatively, the time point analyzed may be too early to see a phenotype, as RAB28‐CRD is a progressive inherited retinal dystrophy. From a therapeutic perspective, rescue of the peak OSP defect by cone‐specific expression of Rab28, suggests that gene therapy for RAB28‐associated CRD may be successful by RAB28 gene restoration to cones.
Having confirmed a role for cone photoreceptor Rab28 in regulating dawn 27 and dusk peaks of OSP, we decided to investigate the fundamental mechanisms regulating peaks of OSP in vivo. This also holds biomedical significance as defective OSP may be part of the disease pathway in RAB28‐linked CRD and in other retinal and macular degenerations. Environmental cues are major regulators of OSP in other species with light‐dark transitions regulating OSP peaks in frog and Arvicanthis ansorgei, whereas internal circadian rhythms can drive OSP peaks in rat and mouse models. 46 , 52 , 55 In zebrafish, we observed a significant decrease in the number of RPE phagosomes present in the retinae of animals reared under a dark‐dark environment for <24 h (Figure 5), suggesting that the burst of OSP in zebrafish is not under circadian regulation.
We then undertook to identify novel molecular regulators of OSP, involved in all stages of the OSP process. Unbiased proteomic analysis allowed us identify 676 proteins differentially expressed in wild‐type sibling eyes across the three time points analyzed, ZT 4, ZT 9, and ZT 17 including Itgav, Abcf1, and Lamp1b, proteins previously linked to OSP regulation. Analyzing protein expression profiles upregulated/ down regulated at ZT 4 and or ZT 17 (OSP peaks) compared with ZT 9 (OSP trough) identified 52 proteins following multiple comparison testing (Figure 6). Only seven proteins are upregulated at both OSP peaks, suggesting that different regulators are involved in dawn and dusk peaks. Importantly, this list included proteins with known involvement in OSP including Rab7a, Tuba1a, and Rp2. 60 , 61 , 62 KEGG pathway analysis uncovered processes expected to be affected during OSP including, protein localization, vesicle docking, organelle organization, and intracellular transport. Notably, several proteins on the list are not annotated, for example, Uniprot entries B3DFK4, A0A0R4ITV0, B8A688. Therefore, this list of proteins differentially expressed during OSP provides several avenues to elucidate novel regulators of OSP. One interesting protein upregulated solely at the ZT 4 peak is the lens protein, Cryba1/βA3/A1‐crystallin. This protein is expressed in the RPE, where it is involved in acidification of lysosomes by vacuolar ATPase modulation. 63 A significant interaction between Rab28 and Cryba1/βA3/A1‐crystallin was previously reported, including in the T26N, or GDP‐preferring variant. 27 Using this list of proteins upregulated at one or both peaks of OSP in zebrafish, we returned to elucidating how Rab28 controls OSP by identifying which of them lose differential expression in Rab28 KO eyes. (Figure 7). Of the 52 candidate proteins, 21 showed a statistically significant relationship between group (rab28 mutant vs. sibling) and time (ZT 4, ZT 9, and ZT 17) (Figure 7C). For an additional two proteins the difference in the group (rab28 mutant vs. sibling) is associated with significantly different LFQ intensity only.
Interestingly, only Park7 was dysregulated at both peak times (ZT 4 and ZT 17) in the rab28 KO (Figure 7C,D,H). Park7, or DJ‐1, is a redox‐sensitive molecular chaperone linked with Parkinson's disease and also involved in regulating the RPE’s response to oxidative stress. 56 No previous studies have postulated a role for Park7 in OSP, but it is well known that phagocytosis itself increases oxidative stress leading to increase levels of reactive oxygen species. Oxidative stress is also induced as a result of imbalance between the OS renewal and the phagocytic activity which scavenge the OS tips, which may account for an altered expression pattern in our rab28 KO model. 56 Notably, we also saw distinct differences in the profiles of Rab7a and Rp2, two proteins previously associated with OSP (Figure 7). Rab7a is known to be involved in phagosome maturation in the RPE, and we hypothesize that lower levels of Rab7a may be due to reduced levels of phagosomes produced in the KO retina. 62 Rp2 is also of interest as human mutations lead to CRD. 64 Knockout of Rp2 leads to defects in OS renewal, and it has been postulated that this could be in part due to a defect in OSP. 60
Diminished levels of peak OSP, as mentioned earlier, may contribute to later‐onset impaired vision. Therefore, to determine if the loss of OSP peaks in rab28 KOs has earlier functional consequences in the retina, we investigated defects in the visual cycle. Several studies link OSP to the visual cycle, as engulfment of OS tips by the RPE is another method of retinoid recycling and distinct to the canonical and non‐canonical pathways that shuttle retinoids from photoreceptors to the RPE or Muller glia. 12 , 13
From our proteomics analysis of 2 mpf eyes, the retinyl flippase Abca4b was downregulated in the rab28 KO at both ZT 4 and ZT 9 (Figure 2F). Investigation of retinoid levels unveiled reduced retinyl esters atRP and 11cRP from 15 days old in rab28 KO (Figure 8A ). Adult rab28 KO eyes show a progressive defect in the visual cycle, as levels of the visual chromophore 11 cRAL become significantly reduced from 15 dpf to 8 mpf (Figure 8B). Bisretinoid analysis revealed an age‐dependent increase in A2PE levels at 12 months old, confirming defective retinoid cycling in rab28 KO (Figure 8C). A2PE is a by‐product of the visual cycle, resulting from two molecules of all‐trans‐retinal and phosphatidylethanolamine. A2PE can be formed in both photoreceptors and RPE cells, unlike A2E a bisretinoid that results after hydrolysis of A2PE in the acidic environment of the RPE lysosomal compartment only. 16 We hypothesize that A2PE is elevated within photoreceptor OS due to the defective OSP phenotype and lower levels of Abca4b in rab28 KO. Accumulation and formation of A2PE may contribute to photoreceptor cell dysfunction. 65
In summary, this study further highlighted the role of Rab28 in OSP, showing its requirement for both the dawn and dusk peak of OSP. Rab28 dysregulation impacts vitamin A dynamics in the eye, by perturbing the recycling of essential retinoids and favoring formation and accumulation of toxic byproducts. Our investigation has also uncovered potential novel regulators of OSP, providing a resource for future studies of OSP, and in particular cone photoreceptor OSP.
DISCLOSURES
The authors declare that the research was conducted in the absence of any commercial or financial relationships that could be construed as a potential conflict of interest.
AUTHOR CONTRIBUTIONS
Ailís L. Moran, Stephen P. Carter, and Breandán N. Kennedy: conceptualization; Ailís L. Moran: data curation; Ailís L. Moran and Breandán N. Kennedy: formal analysis; Ailís L. Moran, Joanna J. Kaylor, Zhichun Jiang, Sanne Broekman, Eugene T. Dillon, Alicia Gómez Sánchez, Michelle Carey, and Breandán N. Kennedy: validation. Ailís L. Moran, Joanna J. Kaylor, Zhichun Jiang, Sanne Broekman, and Alicia Gómez Sánchez: investigation. Ailís L. Moran and Breandán N. Kennedy: methodology; Ailís L. Moran and Breandán N. Kennedy: writing—original draft. Breandán N. Kennedy: resources; Breandán N. Kennedy: supervision; Breandán N. Kennedy: project administration; Ailís L. Moran collected all samples for proteomics, TEM, phagosome analysis, retinoid analysis, bisretinoid analysis and generated the transgenic models in the knockout background. Alicia Gómez Sánchez performed visual function analysis. Sanne Broekman performed ERG analysis. Stephen P. Carter created the original genetic and transgenic models. Joanna J. Kaylor performed retinoid analysis. Zhichun Jiang performed bisretinoid analysis. Eugene T. Dillon performed mass spectrometry analysis. Michelle Carey and Sajal K. Minhas performed statistical analysis of proteomics. Ailís L. Moran, Erwin van Wijk, Roxana A. Radu, Oliver E. Blacque, Gabriel H. Travis, and Breandán N. Kennedy interpreted the results and provided significant intellectual input.
Supporting information
Table S1
ACKNOWLEDGEMENTS
We thank the UCD Conway Institute Imaging Core Facilities, namely Ms. Tiina O’ Neill, Dr. Dimitri Scholz and Dr. Niamh Stephens for imaging support and services and the Biomedical Facility UCD for maintenance of zebrafish stocks. We also thank the Fighting Blindness‐UCD PPI in Vision Research group for their meaningful insights into this project. Open Access Funding provided by The University College Dublin within the IREL Agreement [Correction added on June 13, 2022, after first online publication: IREL Funding statement has been added.]
Moran AL, Carter SP, Kaylor JJ, et al. Dawn and dusk peaks of outer segment phagocytosis, and visual cycle function require Rab28. FASEB J. 2022;36:e22309. doi: 10.1096/fj.202101897R
Funding information
This project received funding from: the Irish Research Council grant EPS2019/526. This publication has emanated from research supported in part by grants from Science Foundation Ireland under grant numbers 18/CRT/6049 and 20/FFP‐P/8538. The European Union's Horizon 2020 Research and Innovation Programme under grant agreement numbers 734907 (3DNEONET) and 101007931 (CRYSTAL3). A UCLA Stein Eye Institute, unrestricted grant from Research to Prevent Blindness, Inc. (RPB, New York).
DATA AVAILABILITY STATEMENT
Raw data supporting the findings of this study are available from the corresponding author on request.
REFERENCES
- 1. Bujakowska KM, Liu Q, Pierce EA. Photoreceptor cilia and retinal ciliopathies. Cold Spring Harb Perspect Biol. 2017;9(10):a028274. [DOI] [PMC free article] [PubMed] [Google Scholar]
- 2. Carter SP, Blacque OE. Membrane retrieval, recycling and release pathways that organise and sculpt the ciliary membrane. Curr Opin Cell Biol. 2019;59:133‐139. [DOI] [PubMed] [Google Scholar]
- 3. Molday RS, Moritz OL. Photoreceptors at a glance. J Cell Sci. 2015;128(22):4039‐4045. [DOI] [PMC free article] [PubMed] [Google Scholar]
- 4. Salinas RY, Pearring JN, Ding JD, Spencer WJ, Hao Y, Arshavsky VY. Photoreceptor discs form through peripherin‐dependent suppression of ciliary ectosome release. J Cell Biol. 2017;216(5):1489‐1499. [DOI] [PMC free article] [PubMed] [Google Scholar]
- 5. Spencer WJ, Lewis TR, Phan S, et al. Photoreceptor disc membranes are formed through an Arp2/3‐dependent lamellipodium‐like mechanism. Proc Natl Acad Sci USA. 2019;116(52):27043‐27052. [DOI] [PMC free article] [PubMed] [Google Scholar]
- 6. Kevany BM, Palczewski K. Phagocytosis of retinal rod and cone photoreceptors. Physiology. 2010;25(1):8‐15. [DOI] [PMC free article] [PubMed] [Google Scholar]
- 7. Nandrot EF. Animal models, in “The Quest to Decipher RPE Phagocytosis”. Adv Exp Med Biol. 2014;801:77‐83. [DOI] [PubMed] [Google Scholar]
- 8. Nandrot EF, Kim Y, Brodie SE, Huang X, Sheppard D, Finnemann SC. Loss of synchronized retinal phagocytosis and age‐related blindness in mice lacking αvβ5 integrin. J Exp Med. 2004;200(12):1539‐1545. [DOI] [PMC free article] [PubMed] [Google Scholar]
- 9. Gal A, Li Y, Thompson DA, et al. Mutations in MERTK, the human orthologue of the RCS rat retinal dystrophy gene, cause retinitis pigmentosa. Nat Genet. 2000;26(3):270‐271. [DOI] [PubMed] [Google Scholar]
- 10. Inana G, Murat C, An W, Yao X, Harris IR, Cao J. RPE phagocytic function declines in age‐related macular degeneration and is rescued by human umbilical tissue derived cells. J Transl Med. 2018;16(1):63. [DOI] [PMC free article] [PubMed] [Google Scholar]
- 11. Mazzoni F, Safa H, Finnemann SC. Understanding photoreceptor outer segment phagocytosis: use and utility of RPE cells in culture. Exp Eye Res. 2014;126:51‐60. [DOI] [PMC free article] [PubMed] [Google Scholar]
- 12. Kim JY, Zhao H, Martinez J, et al. Noncanonical autophagy promotes the visual cycle. Cell. 2013;154(2):365‐376. [DOI] [PMC free article] [PubMed] [Google Scholar]
- 13. Lenis TL, Hu J, Ng SY, et al. Expression of ABCA4 in the retinal pigment epithelium and its implications for Stargardt macular degeneration. Proc Natl Acad Sci USA. 2018;115(47):E11120‐E11127. [DOI] [PMC free article] [PubMed] [Google Scholar]
- 14. Young RW, Bok D. Autoradiographic studies on the metabolism of the retinal pigment epithelium. Invest Ophthalmol. 1970;9:524‐536. [PubMed] [Google Scholar]
- 15. Young RW, Bok D. Participation of the retinal pigment epithelium in the rodouter segment renewal process. J Cell Biol. 1969;42(9):392‐403. [DOI] [PMC free article] [PubMed] [Google Scholar]
- 16. Liu J, Itagaki Y, Ben‐Shabat S, Nakanishi K, Sparrow JR. The biosynthesis of A2E, a fluorophore of aging retina, involves the formation of the precursor, A2‐PE, in the photoreceptor outer segment membrane. J Biol Chem. 2000;275(38):29354‐29360. [DOI] [PubMed] [Google Scholar]
- 17. Finnemann SC, Leung LW, Rodriguez‐Boulan E. The lipofuscin component A2E selectively inhibits phagolysosomal degradation of photoreceptor phospholipid by the retinal pigment epithelium. Proc Natl Acad Sci USA. 2002;99(6):3842‐3847. [DOI] [PMC free article] [PubMed] [Google Scholar]
- 18. Villanueva‐Mendoza C, Tuson M, Apam‐Garduño D, et al. The genetic landscape of inherited retinal diseases in a mexican cohort: genes, mutations and phenotypes. Genes. 2021;12(11):1824. [DOI] [PMC free article] [PubMed] [Google Scholar]
- 19. Iarossi G, Marino V, Maltese PE, et al. Expanding the clinical and genetic spectrum of RAB28‐related cone‐rod dystrophy: pathogenicity of novel variants in Italian families. Int J Mol Sci. 2020;22(1):381. [DOI] [PMC free article] [PubMed] [Google Scholar]
- 20. Lee GI, Lee C, Subramanian S, et al. A novel likely pathogenic variant in the RAB28 gene in a Korean patient with cone–rod dystrophy. Ophthalmic Genet. Published Online 2017;38(6):587‐589. [DOI] [PubMed] [Google Scholar]
- 21. Roosing S, Rohrschneider K, Beryozkin A, et al. Mutations in RAB28, encoding a farnesylated small GTPase, are associated with autosomal‐recessive cone‐rod dystrophy. Am J Hum Genet. 2013;93(1):110‐117. [DOI] [PMC free article] [PubMed] [Google Scholar]
- 22. Riveiro‐Álvarez R, Xie Y, López‐Martínez MÁ, et al. New mutations in the RAB28 gene in 2 Spanish families with conerod dystrophy. JAMA Ophthalmol. Published Online 2015;133(2):133‐139. [DOI] [PMC free article] [PubMed] [Google Scholar]
- 23. Jespersgaard C, Hey AB, Ilginis T, et al. A Missense mutation in RAB28 in a family with cone‐rod dystrophy and postaxial polydactyly prevents localization of RAB28 to the primary cilium. Invest Ophthalmol Vis Sci. Published Online 2020;61(2):29. [DOI] [PMC free article] [PubMed] [Google Scholar]
- 24. Jensen VL, Carter S, Sanders AAWM, et al. Whole‐organism developmental expression profiling identifies RAB‐28 as a novel ciliary GTPase associated with the BBSome and intraflagellar transport. PLoS Genet. Published Online 2016;12(12):e1006469. [DOI] [PMC free article] [PubMed] [Google Scholar]
- 25. Akella JS, Carter SP, Nguyen K, et al. Ciliary Rab28 and the BBSome negatively regulate extracellular vesicle shedding. eLife. 2020;9:e50580. [DOI] [PMC free article] [PubMed] [Google Scholar]
- 26. Ying G, Boldt K, Ueffing M, Gerstner CD, Frederick JM, Baehr W. The small GTPase RAB28 is required for phagocytosis of cone outer segments by the murine retinal pigmented epithelium. J Biol Chem. 2018;293(45):17546‐17558. [DOI] [PMC free article] [PubMed] [Google Scholar]
- 27. Carter SP, Moran AL, Matallanas D, McManus GJ, Blacque OE, Kennedy BN. Genetic deletion of zebrafish Rab28 causes defective outer segment shedding, but not retinal degeneration. Front Cell Dev Biol. 2020;8:136. [DOI] [PMC free article] [PubMed] [Google Scholar]
- 28. Angueyra JM, Kindt KS. Leveraging zebrafish to study retinal degenerations. Front Cell Dev Biol. 2018;6:110. [DOI] [PMC free article] [PubMed] [Google Scholar]
- 29. Lewis TR, Kundinger SR, Link BA, Insinna C, Besharse JC. Kif17 phosphorylation regulates photoreceptor outer segment turnover. BMC Cell Biol. 2018;19(1):25. [DOI] [PMC free article] [PubMed] [Google Scholar]
- 30. Kennedy G, Sundaramurthi H. UCD Biomedical Facility Staff, Kennedy BK. University College Dublin (UCD) Zebrafish Facility Environmental Parameters; 2019. [Google Scholar]
- 31. Gómez Sánchez A, Álvarez Y, Colligris B, Kennedy BN. Affordable and effective optokinetic response methods to assess visual acuity and contrast sensitivity in larval to juvenile zebrafish. Open Res Europe. 2021;1:92. [DOI] [PMC free article] [PubMed] [Google Scholar]
- 32. Quint WH, Tadema KCD, de Vrieze E, et al. Loss of Gap Junction Delta‐2 (GJD2) gene orthologs leads to refractive error in zebrafish. Commun Biol. 2021;4(1):676. [DOI] [PMC free article] [PubMed] [Google Scholar]
- 33. Ward R, Kaylor JJ, Cobice DF, et al. Non‐photopic and photopic visual cycles differentially regulate immediate, early, and late phases of cone photoreceptor‐mediated vision. J Biol Chem. 2020;295(19):6482‐6497. [DOI] [PMC free article] [PubMed] [Google Scholar]
- 34. Radu RA, Yuan Q, Hu J, et al. Accelerated accumulation of lipofuscin pigments in the RPE of a mouse model for ABCA4‐mediated retinal dystrophies following vitamin A supplementation. Invest Opthalmol vis Sci. 2008;49(9):3821. [DOI] [PMC free article] [PubMed] [Google Scholar]
- 35. Tyanova S, Temu T, Cox J. The MaxQuant computational platform for mass spectrometry‐based shotgun proteomics. Nat Protoc. 2016;11(12):2301‐2319. [DOI] [PubMed] [Google Scholar]
- 36. Cox J, Mann M. MaxQuant enables high peptide identification rates, individualized p.p.b.‐range mass accuracies and proteome‐wide protein quantification. Nat Biotechnol. 2008;26(12):1367‐1372. [DOI] [PubMed] [Google Scholar]
- 37. Cox J, Hein MY, Luber CA, Paron I, Nagaraj N, Mann M. Accurate proteome‐wide label‐free quantification by delayed normalization and maximal peptide ratio extraction, termed MaxLFQ. Mol Cell Proteom. 2014;13(9):2513‐2526. [DOI] [PMC free article] [PubMed] [Google Scholar]
- 38. Tyanova S, Temu T, Sinitcyn P, et al. The Perseus computational platform for comprehensive analysis of (prote)omics data. Nat Methods. 2016;13(9):731‐740. [DOI] [PubMed] [Google Scholar]
- 39. Bindea G, Mlecnik B, Hackl H, et al. ClueGO: a Cytoscape plug‐in to decipher functionally grouped gene ontology and pathway annotation networks. Bioinformatics. 2009;25(8):1091‐1093. [DOI] [PMC free article] [PubMed] [Google Scholar]
- 40. Bindea G, Galon J, Mlecnik B. CluePedia Cytoscape plugin: pathway insights using integrated experimental and in silico data. Bioinformatics. 2013;29(5):661‐663. [DOI] [PMC free article] [PubMed] [Google Scholar]
- 41. Shannon P, Markiel A, Ozier O, et al. Cytoscape: a software environment for integrated models of biomolecular interaction networks. Genome Res. 2003;13(11):2498‐2504. [DOI] [PMC free article] [PubMed] [Google Scholar]
- 42. Kanehisa M. KEGG: kyoto encyclopedia of genes and genomes. Nucleic Acids Res. 2000;28(1):27‐30. [DOI] [PMC free article] [PubMed] [Google Scholar]
- 43. Khan M, Cremers FPM. ABCA4‐associated stargardt disease. Klin Monbl Augenheilkd. 2020;237(03):267‐274. [DOI] [PubMed] [Google Scholar]
- 44. Scortecci JF, Molday LL, Curtis SB, et al. Cryo‐EM structures of the ABCA4 importer reveal mechanisms underlying substrate binding and Stargardt disease. Nat Commun. 2021;12(1):5902. [DOI] [PMC free article] [PubMed] [Google Scholar]
- 45. Allikmets R, Singh N, Sun H, et al. A photoreceptor cell‐specific ATP‐binding transporter gene (ABCR) is mutated in recessive Starqardt macular dystrophy. Nat Genet. 1997;15(3):236‐246. [DOI] [PubMed] [Google Scholar]
- 46. LaVail MM. Rod outer segment disk shedding in rat retina: relationship to cyclic lighting. Science. 1976;194(4269):1071‐1074. [DOI] [PubMed] [Google Scholar]
- 47. Basinger S, Hoffman R, Matthes M. Photoreceptor shedding is initiated by light in the frog retina. Science. 1976;194(4269):1074‐1076. [DOI] [PubMed] [Google Scholar]
- 48. Hoang T, Wang J, Boyd P, et al. Gene regulatory networks controlling vertebrate retinal regeneration. Science. 2020;370(6519):eabb8598. [DOI] [PMC free article] [PubMed] [Google Scholar]
- 49. Kennedy BN, Alvarez Y, Brockerhoff SE, et al. Identification of a zebrafish cone photoreceptor‐specific promoter and genetic rescue of achromatopsia in the nof mutant. Invest Opthalmol vis Sci. 2007;48(2):522. [DOI] [PubMed] [Google Scholar]
- 50. Guadagno NA, Progida C. Rab GTPases: switching to human diseases. Cells. 2019;8(8):909. [DOI] [PMC free article] [PubMed] [Google Scholar]
- 51. LaVail MM, Ward PA. Studies on the hormonal control of circadian outer segment disc shedding in the rat retina. Invest Ophthalmol Vis Sci. 1978;17(12):1183‐1189. [PubMed] [Google Scholar]
- 52. LaVail MM. Circadian nature of rod outer segment disc shedding in the rat. Invest Ophthalmol Vis Sci. 1980;19(4):407‐411. [PubMed] [Google Scholar]
- 53. Lorach H, Kang S, Dalal R, Bhuckory MB, Quan Y, Palanker D. Long‐term rescue of photoreceptors in a rodent model of retinitis pigmentosa associated with MERTK mutation. Sci Rep. 2018;8(1):11312. [DOI] [PMC free article] [PubMed] [Google Scholar]
- 54. Yu S, Li C, Biswas L, et al. CERKL gene knockout disturbs photoreceptor outer segment phagocytosis and causes rod‐cone dystrophy in zebrafish. Hum Mol Genet. 2017;26(12):2335‐2345. [DOI] [PubMed] [Google Scholar]
- 55. Milićević N, Ait‐Hmyed Hakkari O, Bagchi U, et al. Core circadian clock genes Per1 and Per2 regulate the rhythm in photoreceptor outer segment phagocytosis. FASEB J. 2021;35(7):e21722. [DOI] [PubMed] [Google Scholar]
- 56. Shadrach KG, Rayborn ME, Hollyfield JG, Bonilha VL. DJ‐1‐dependent regulation of oxidative stress in the retinal pigment epithelium (RPE). PLoS One. 2013;8(7):e67983. [DOI] [PMC free article] [PubMed] [Google Scholar]
- 57. Lakkaraju A, Umapathy A, Tan LX, et al. The cell biology of the retinal pigment epithelium. Prog Retin Eye Res. 2020;78:100846. [DOI] [PMC free article] [PubMed] [Google Scholar]
- 58. Sparrow JR, Gregory‐Roberts E, Yamamoto K, et al. The bisretinoids of retinal pigment epithelium. Prog Retin Eye Res. 2012;31(2):121‐135. [DOI] [PMC free article] [PubMed] [Google Scholar]
- 59. Yu C, Muñoz LE, Mallavarapu M, Herrmann M, Finnemann SC. Annexin A5 regulates surface αvβ5 integrin for retinal clearance phagocytosis. J Cell Sci. Published online January 1, 2019. 2019;132(20):jcs232439. 10.1242/jcs.232439 [DOI] [PMC free article] [PubMed] [Google Scholar]
- 60. Li L, Rao KN, Zheng‐Le Y, Hurd TW, Lillo C, Khanna H. Loss of retinitis pigmentosa 2 (RP2) protein affects cone photoreceptor sensory cilium elongation in mice. Cytoskeleton. 2015;72(9):447‐454. [DOI] [PMC free article] [PubMed] [Google Scholar]
- 61. Jiang M, Esteve‐Rudd J, Lopes VS, et al. Microtubule motors transport phagosomes in the RPE, and lack of KLC1 leads to AMD‐like pathogenesis. J Cell Biol. 2015;210(4):595‐611. [DOI] [PMC free article] [PubMed] [Google Scholar]
- 62. Vieira OV, Bucci C, Harrison RE, et al. Modulation of Rab5 and Rab7 recruitment to phagosomes by phosphatidylinositol 3‐kinase. Mol Cell Biol. 2003;23(7):2501‐2514. [DOI] [PMC free article] [PubMed] [Google Scholar]
- 63. Valapala M, Wilson C, Hose S, et al. Lysosomal‐mediated waste clearance in retinal pigment epithelial cells is regulated by CRYBA1/βA3/A1‐crystallin via V‐ATPase‐MTORC1 signaling. Autophagy. 2014;10(3):480‐496. [DOI] [PMC free article] [PubMed] [Google Scholar]
- 64. Zhang H, Hanke‐Gogokhia C, Jiang L, et al. Mistrafficking of prenylated proteins causes retinitis pigmentosa 2. FASEB J. 2015;29(3):932‐942. [DOI] [PMC free article] [PubMed] [Google Scholar]
- 65. Kim SR, Nakanishi K, Itagaki Y, Sparrow JR. Photooxidation of A2‐PE, a photoreceptor outer segment fluorophore, and protection by lutein and zeaxanthin. Exp Eye Res. 2006;82(5):828‐839. [DOI] [PubMed] [Google Scholar]
Associated Data
This section collects any data citations, data availability statements, or supplementary materials included in this article.
Supplementary Materials
Table S1
Data Availability Statement
Raw data supporting the findings of this study are available from the corresponding author on request.