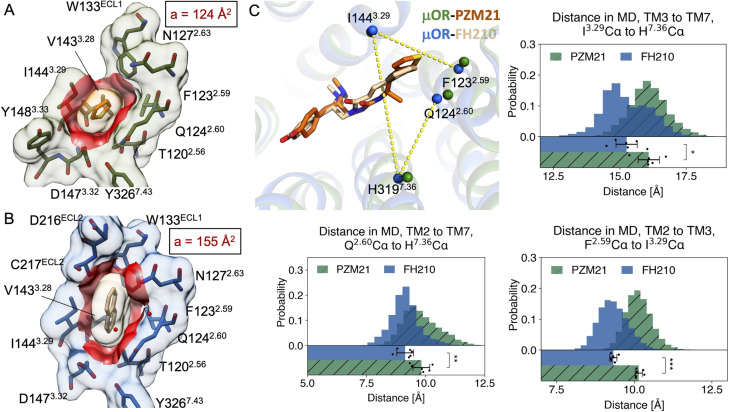
Figure 4.
Comparison of μOR bound to PZM21 and FH210. A), B) Contact surface area (red) between the thiophene of PZM21 (orange) and the PZM21‐μOR cryoEM complex (green), a=124 Å2; and between the naphthyl of FH210 (beige) and the FH210‐μOR cryoEM complex (blue), a=155 Å2. Contact surface area was calculated with a cut‐off value of 2 Å using UCSF Chimera. [16] C) Representative structures extracted from MD simulations of PZM21‐μOR and FH210‐μOR. The simulations show a more compact lipophilic vestibule for FH210 bound μOR. The distances are measured between the Cα atoms of the labeled residues. The histogram plots on the right shows the distance distribution over all simulations. The bar chart at the bottom of each plot shows the mean and SEM, with the dots representing the individual values. These statistics are based on 6 individual simulations and the first 500 ns of each simulation was not included in these analyses.

