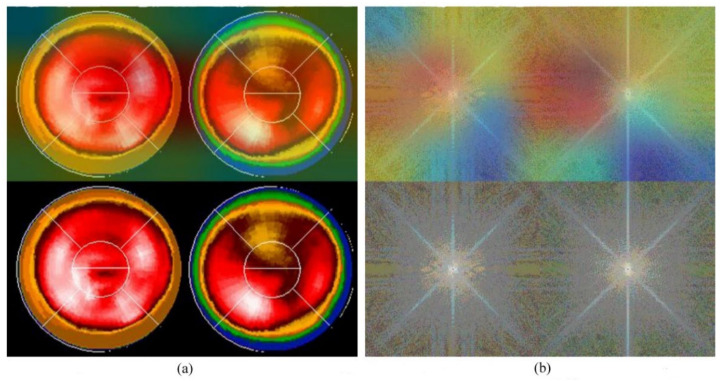
Figure 7.
The GradCAM plots, Case 595: (a) Results of Experiment 1: the lower part is the “pure bull-eye” image, and the upper part is its GradCAM visualization; (b) results of Experiment 2: the lower part is the frequency spectrum computed from (a), the pure bull’s-eye image, and the upper part is its GradCAM visualization.

