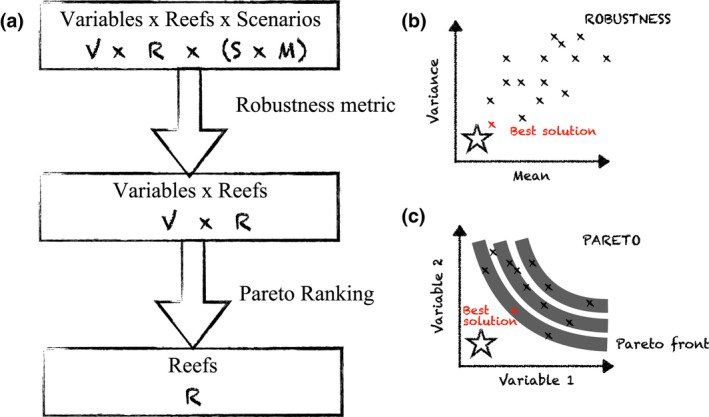
FIGURE 1.

Overview of prioritization approach. (a) The input dataset includes V variables, R reefs and SxM climate change scenarios and models. A robust future thermal stress variable was calculated to provide a matrix of V variables per R reefs. Then, Pareto optimization was used to rank each reef. (b) Using a robustness metric, an ideal site (location shown by the star symbol) has a low mean and variance. In other words, consistently low thermal stress under all scenarios. (c) According to the Pareto ranking, an ideal site (star location) has low stress for all variables. Sites closest to the optimal solution are preferred (red x)
