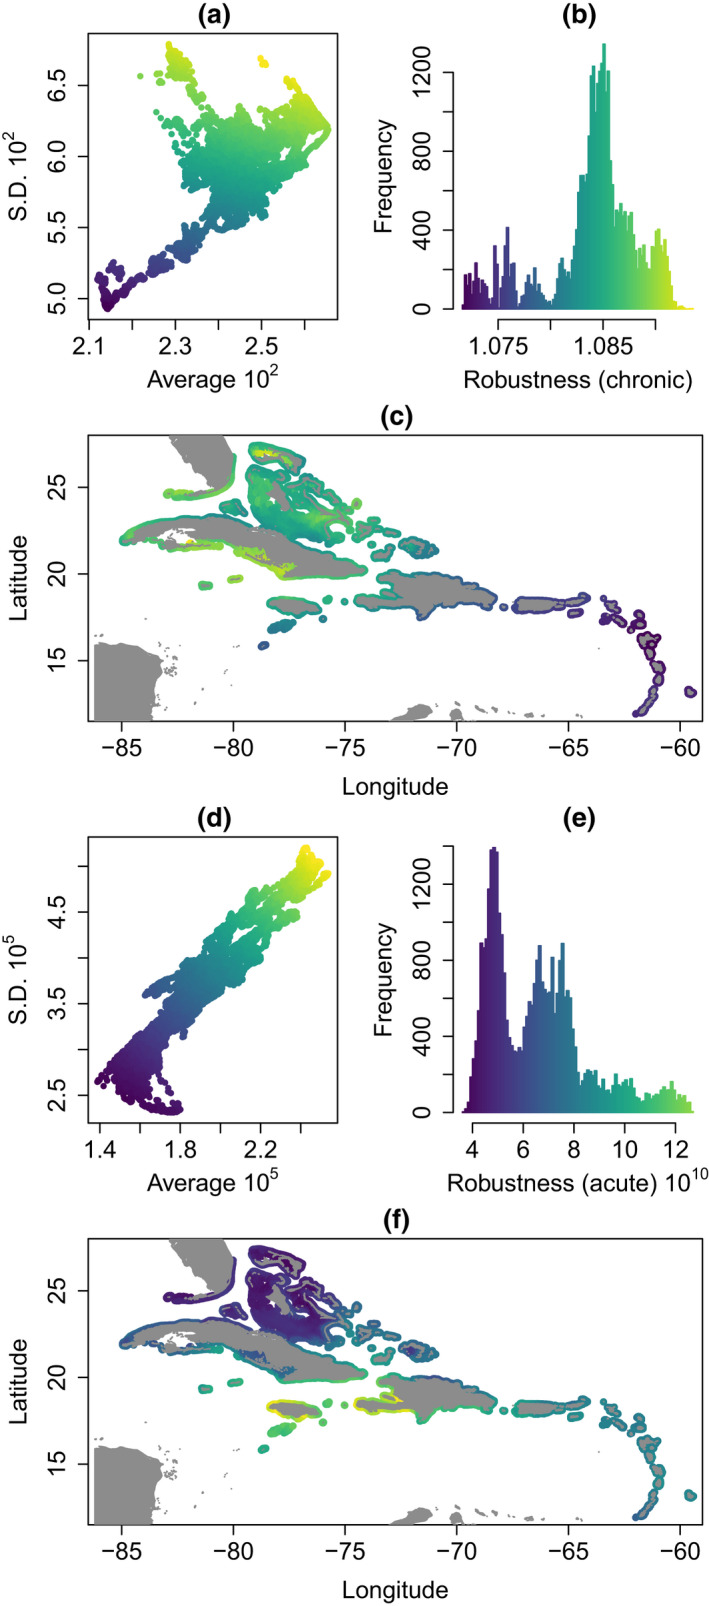
FIGURE 2.

Robustness metric for chronic and acute thermal stress. (a) Mean versus standard deviation of chronic thermal stress under different climate scenarios and models. (b) Histogram of robustness metric for chronic thermal stress. (c) Map of chronic stress robustness metric. (d) Mean versus standard deviation of acute thermal stress under different climate scenarios and models. (e) Histogram of robustness metric for acute thermal stress. (f) Map of acute stress robustness metric. The change in colour from purple to yellow depicts the magnitude of the robustness metric in all panels
