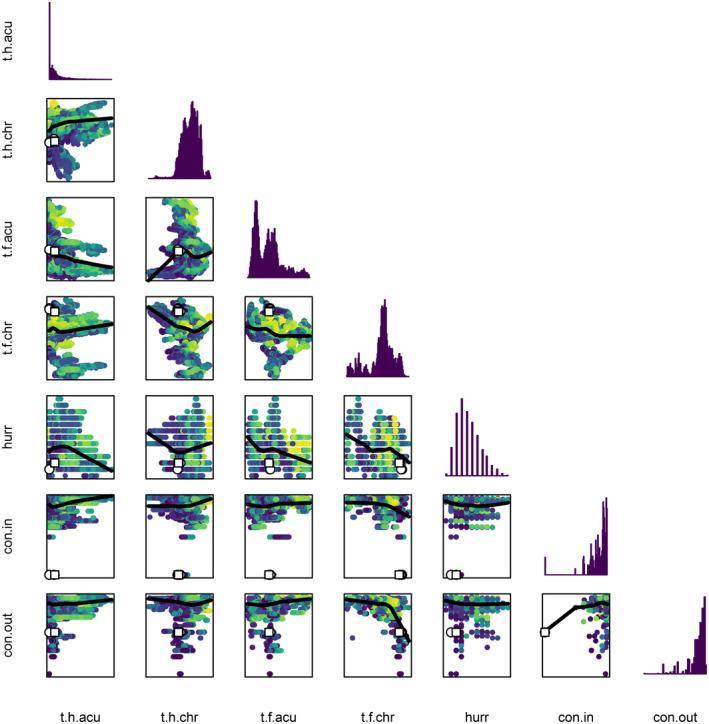
FIGURE 3.

Trade‐offs between input variables: acute historical thermal stress (t.h.acu), chronic historical thermal stress (t.h.chr), acute future thermal stress (t.f.acu), chronic future thermal stress (t.f.chr), hurricane impact (hurr), in‐strength connectivity (con.in), and out‐strength connectivity (con.out). Diagonal contains histograms for each variable. The lower diagonal has pairwise scatterplots (lower values are always desired). Each variable ranges between 0 and 1. Each circle represents a site. Sites have been coloured according to their Pareto ranking, with purple showing the lowest values and yellow the highest values. Blackline shows a lowess smoother. The three best ranking MPA sites (circles) and non‐MPA sites (squares) are highlighted
