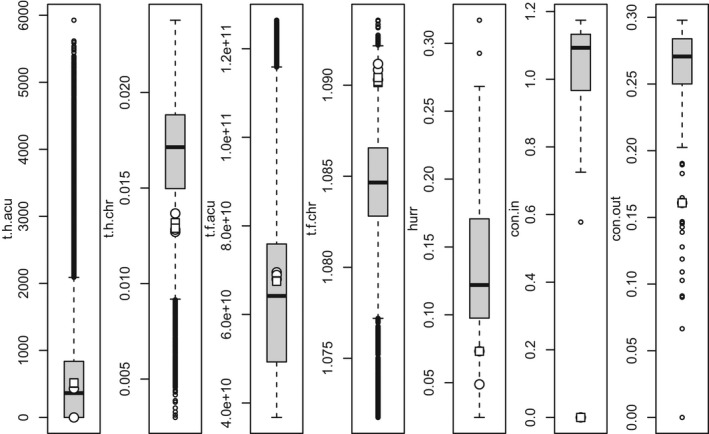
FIGURE 4.

Boxplots showing input variables for the region of study. In boxplots, the line indicates the median, boxes the interquartile range (IQR, 25th and 75th percentile) and whiskers the highest and lowest value excluding outliers (1.5*IQR). Dots show potential outliers. The three best ranking MPA sites (circles) and non‐MPA sites (squares) are highlighted. Variable names are the same as in Figure 3
