
FIGURE 2.
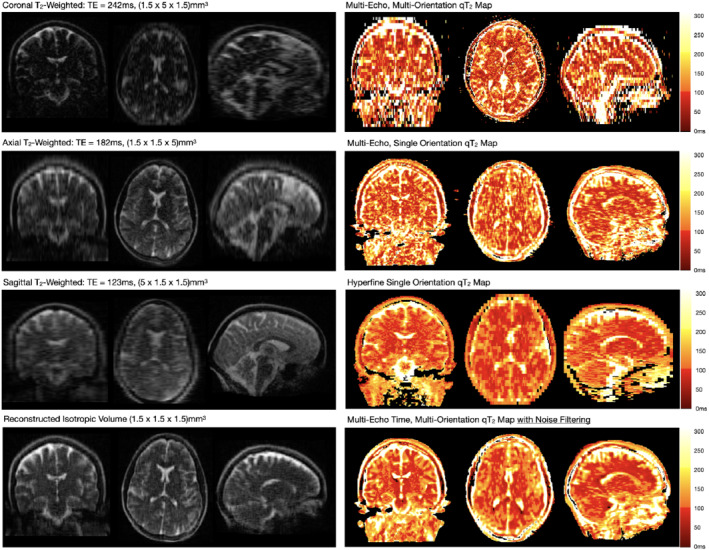
Analysis workflow from the acquisition of the source anisotropic T2‐weighted data with coronal, axial, and sagittal orientations (left panel); SR reconstruction of an isotropic T2‐weighted image from the acquired data (bottom, left panel); and calculation of qT2 maps from the aligned and resampled multi‐orientation data (top, right panel). For comparison, qT2 maps calculated from multiple TEs acquired in a single orientation and using Hyperfine‐provided five‐TE approach (middle, right panel) are also shown. As well, we show a multi‐orientation + multi‐TI qT2 calculated from data that was preprocessed using adaptive denoising (bottom, right panel)