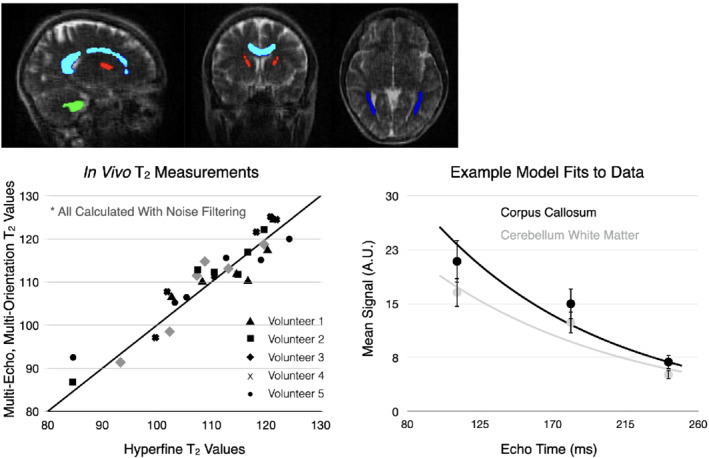
FIGURE 3.

Comparison of qT2 values from four brain regions of interest (top) in each healthy volunteer. Brain regions included cerebellar white matter (green), corpus callosum (light blue), anterior internal capsule (red), and posterior thalamic radiations (dark blue). The ICC between the noise filtered multi‐orientation + multi‐TE and reference Hyperfine 5‐TE qT2 values was 0.93. Example monoexponential fits to the corpus callosum and cerebellar white matter data from one of the healthy volunteers is also shown
