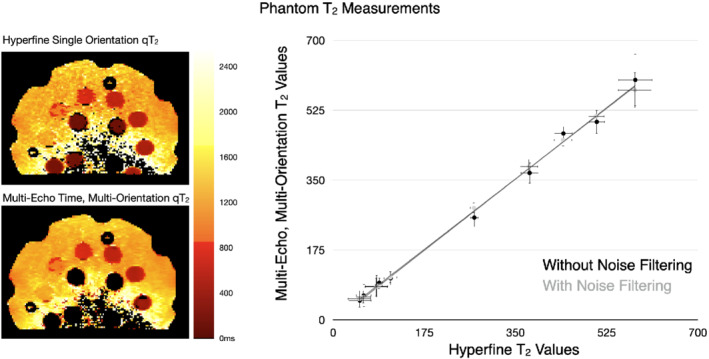
FIGURE 4.

(Left) Comparison of qT2 images through the multi‐element phantom and (Right) Mean phantom multi‐orientation + multi‐TE and reference Hyperfine 5‐TE qT2 values. The solid line corresponds to the line of unity, and errors bars in the phantom measurements denote 1 SD. ICC values for the phantom data were 0.97 (with denoising) and 0.96 (without denoising)
