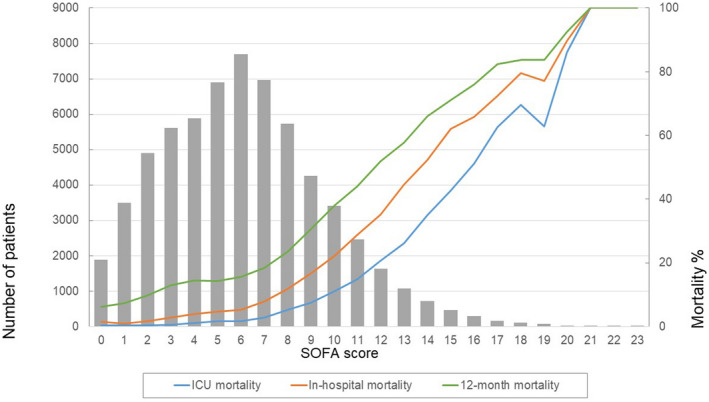
FIGURE 3.

The number of patients and mortality according to first‐day total SOFA score. ICU mortality (blue line), in‐hospital mortality (red line) and 12‐month mortality (green line) increased with increasing total SOFA score. The bars present the number of patients within each total SOFA score group
