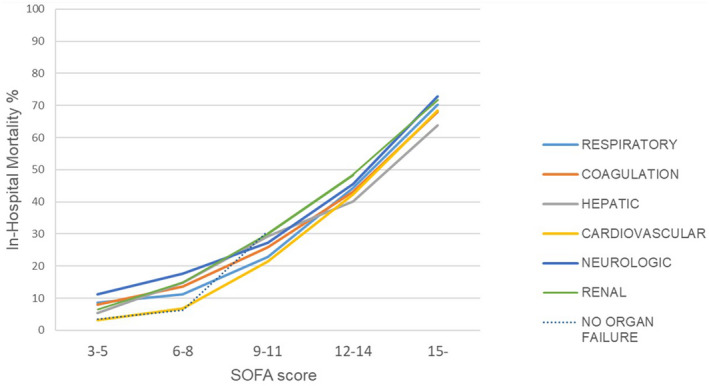
FIGURE 6.

Mortality in patients with different organ failures according to total SOFA score. The lines represent in‐hospital mortality in patients with respiratory (light blue), coagulation (orange), hepatic (grey), cardiovascular (yellow), neurologic (purple) and renal (green) failure. The organ failure was determined as organ‐specific SOFA score 3 or 4. Mortality in patients without any first‐day organ failure is shown with black dashed line
