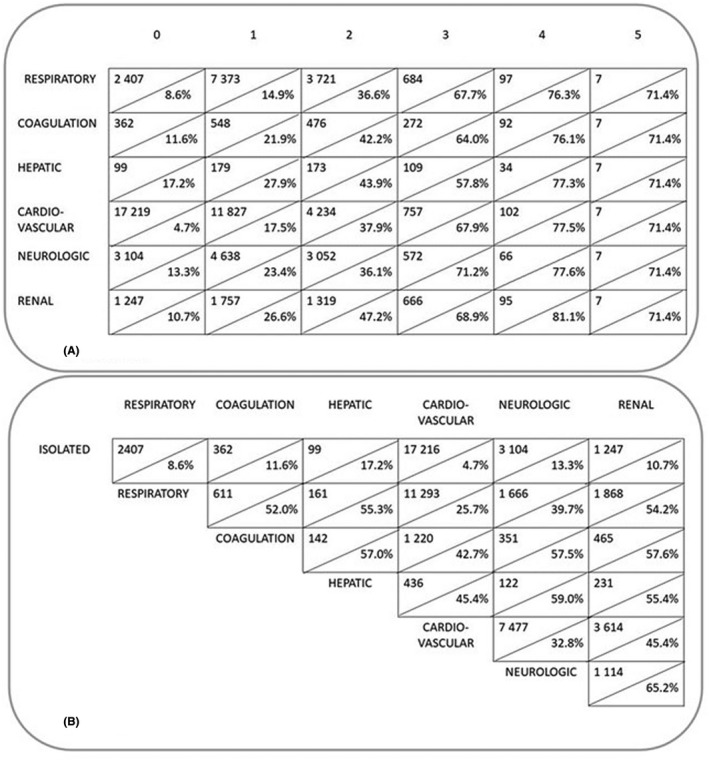
FIGURE 7.

Mortality according to the number of failing organ systems and mortality in groups with at least two simultaneous organ failures. In panel a, each organ failure is represented by a line. In each box, the number above the diagonal line presents the number of patients with the column title‐presented number of additional failing organ systems in addition to the organ failure of that line. The percentage below the diagonal line presents the in‐hospital mortality of these patients. Panel b presents the number of patients with a combination of at least two organ failures. The percentage below the diagonal line shows the in‐hospital mortality in patients with that particular combination
