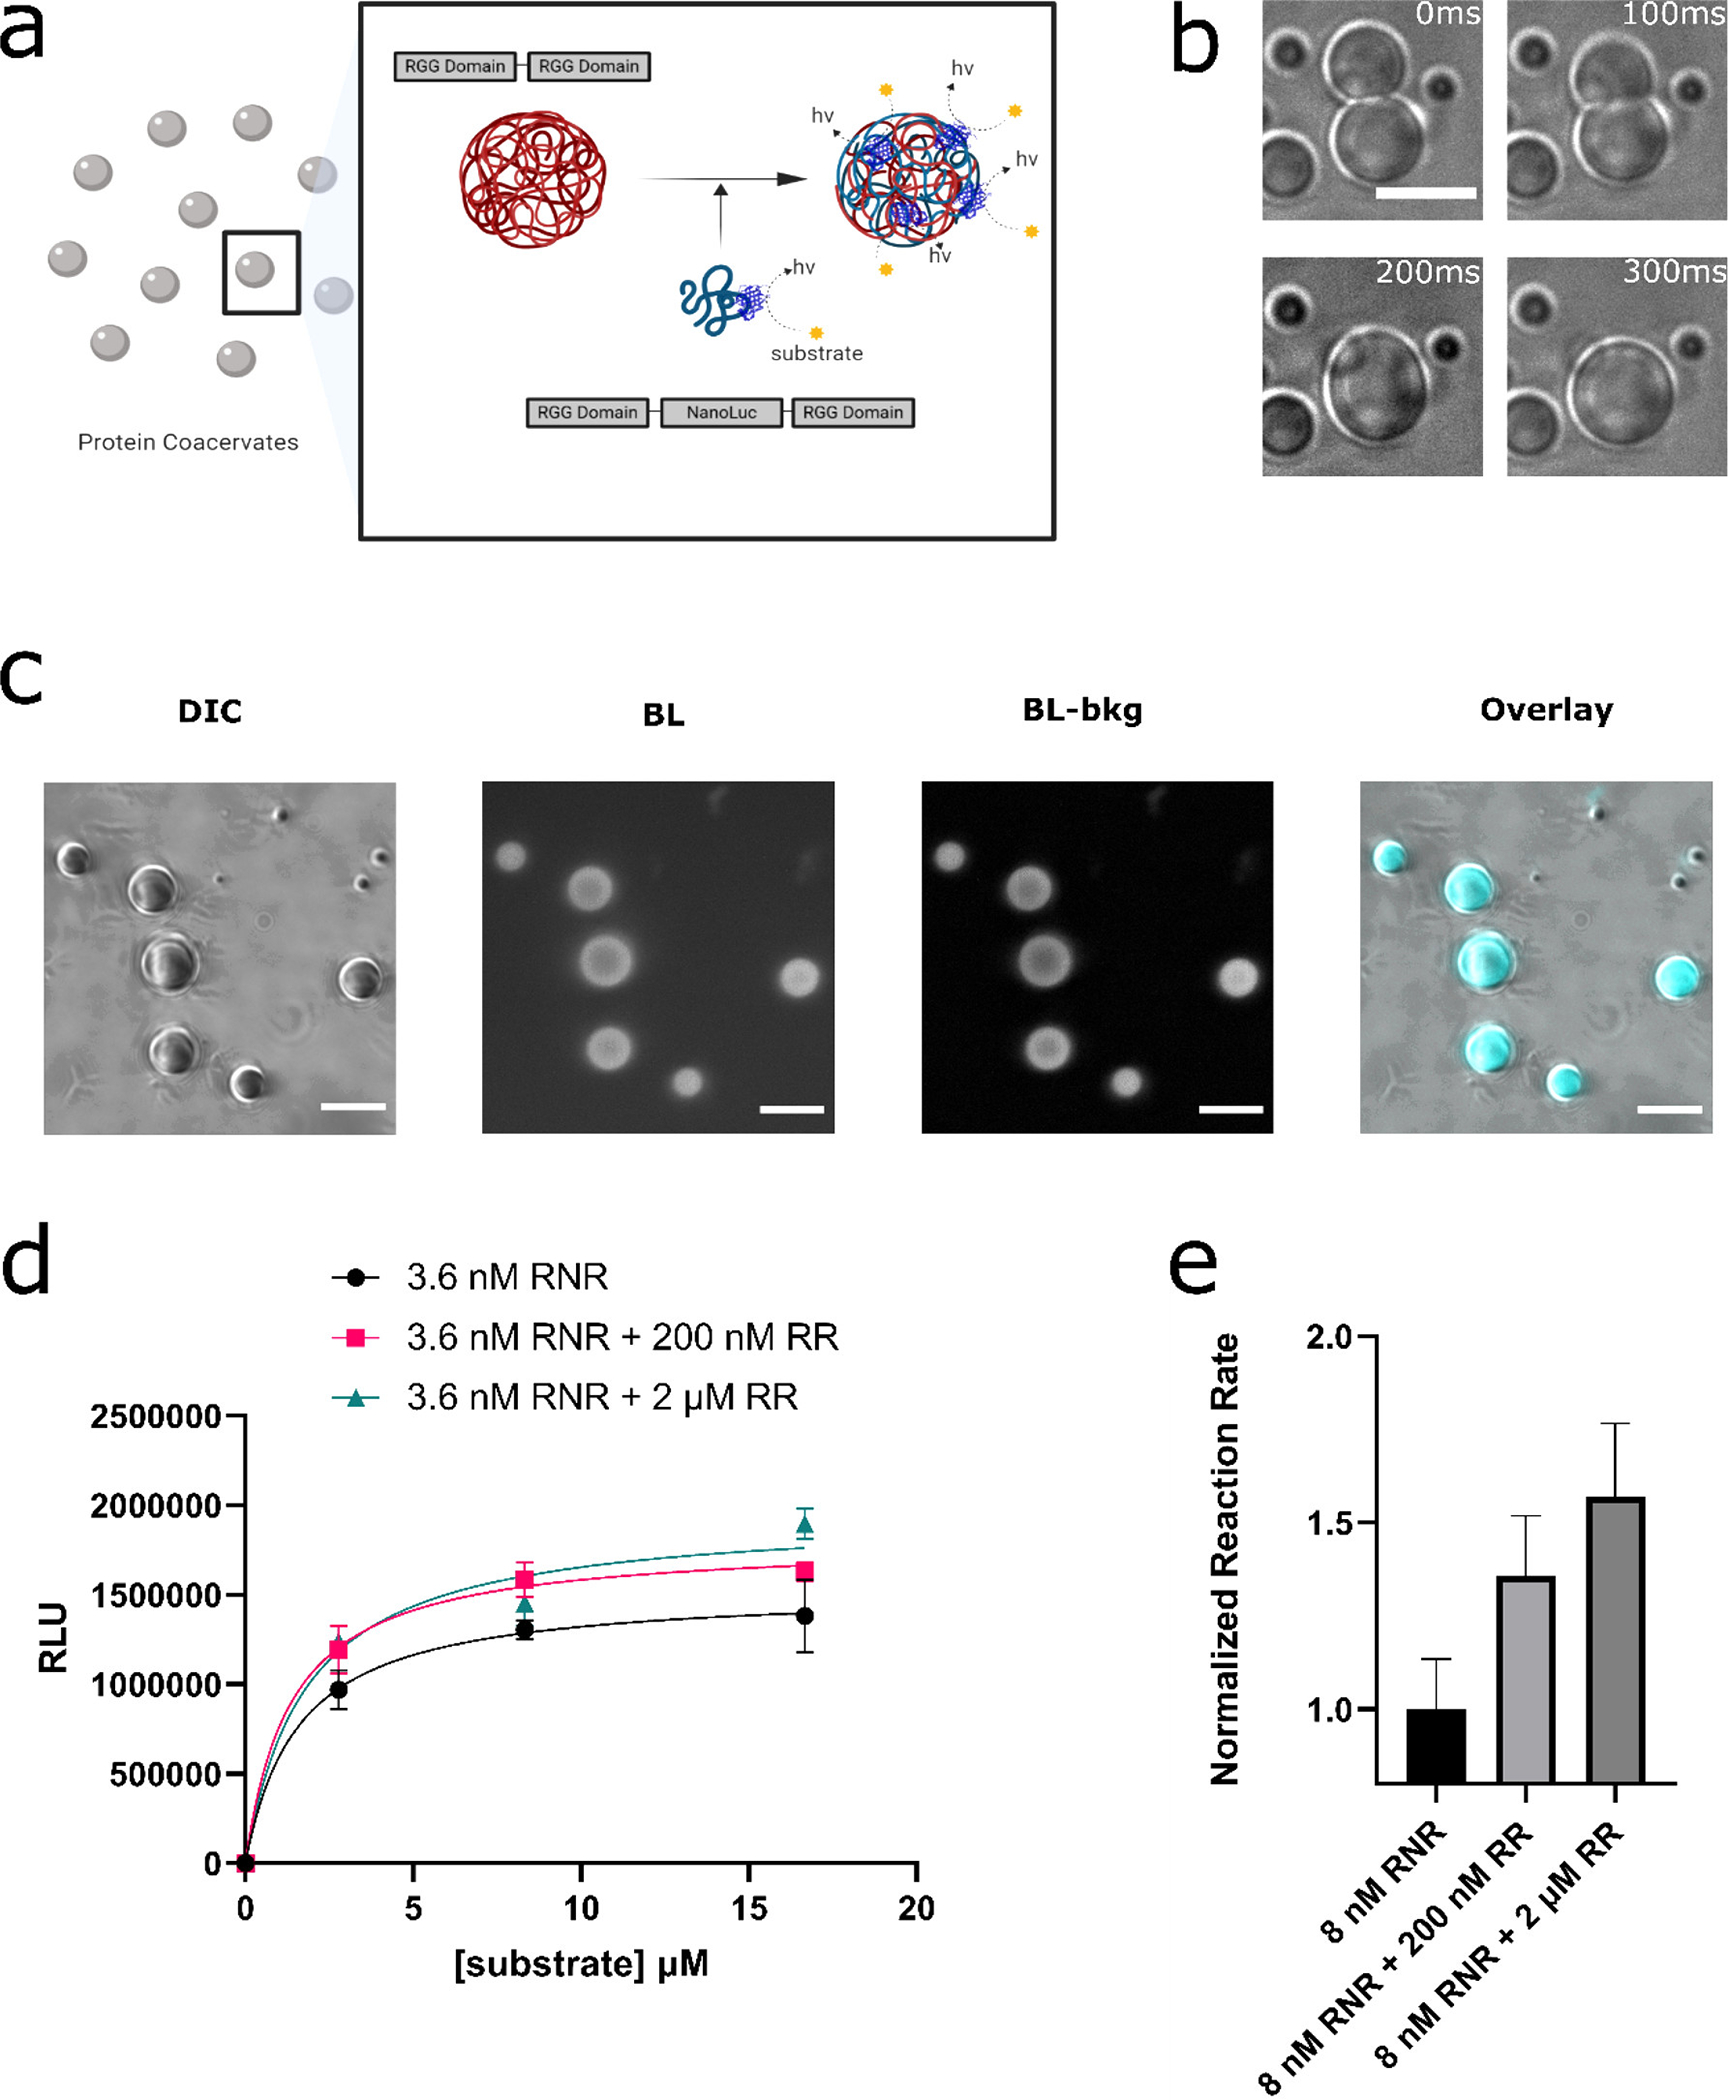
Figure 1.

Incorporation of NanoLuc enzyme into RGG based protein coacervates. (a) Schematic of design goal: (i) localization of NanoLuc enzyme molecules in RGG-based protein coacervates and (ii) studying the enzymatic reaction via bioluminescence imaging under a microscope or quantification by a luminometer. (b) RGG-NanoLuc-RGG coacervates displayed fusion, demonstrating their liquid-like properties, and ultimately attained a spherical shape. The coacervates can also be seen as transparent in this figure. Scale bar: 10 μm. (c) DIC and bioluminescence images of 6μM RGG-NanoLuc-RGG, imaged by an inverted microscope, confirming the enzymatic activity of NanoLuc inside the liquid coacervates. From left to right: DIC image; Bioluminescence image after 5 s exposure at a substrate concentration of ~833 μM (6x dilution of Nano-Glo assay substrate) (50); Bioluminescence image – background subtracted; Overlay, with pseudo-color. Scale bars: 10 μm. (d-e) Reaction kinetics of NanoLuc in different coacervation states measured by a microplate reader. Low concentration of RGG-NanoLuc-RGG (abbreviated as ‘RNR’) was expected to have a low tendency for LLPS. In contrast, with the presence with elevated concentration of scaffold RGG-RGG (abbreviated as ‘RR’), RGG-NanoLuc-RGG was expected to partition into the RGG-RGG condensates. (d) Comparison of reaction kinetics between 3.6 nM RGG-NanoLuc-RGG, 3.6 nM RGG-NanoLuc-RGG with 200 nM RGG-RGG, and 3.6 nM RGG-NanoLuc-RGG with 2 μM RGG-RGG, in a final solution of 150 mM NaCl, 20 mM Tris, 1 mM DTT. Sample volume: 25 μl. Data were fit into Michaelis–Menten equation in GraphPad Prism 9. (e) Comparison of normalized reaction rates. Nano-Glo assay substrate was diluted 100x and 5 μl was added into each well containing 25 μl sample in 150 mM NaCl, 20 mM Tris, 1 mM DTT.
