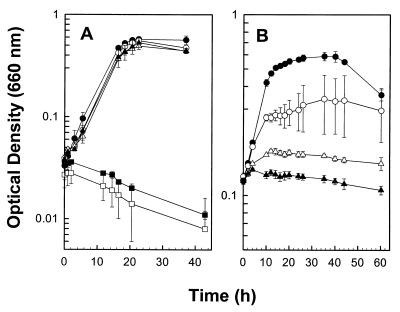
FIG. 2.
Effect of O2 on the glucose-dependent growth of RD-1. Culture tubes were either incubated horizontally and shaken prior to each measurement (A) or continuously shaken (B). Data are the means of three replicates (± standard deviations). The initial concentrations of O2 (vol/vol) in the headspace were ●, 0%; ○, 4%; ▵, 5%; ▴, 6%; ▪, 7%; and □, 9% (A) or ●, 0%; ○, 2%; ▴, 3%; and ▵, 6% (B).

