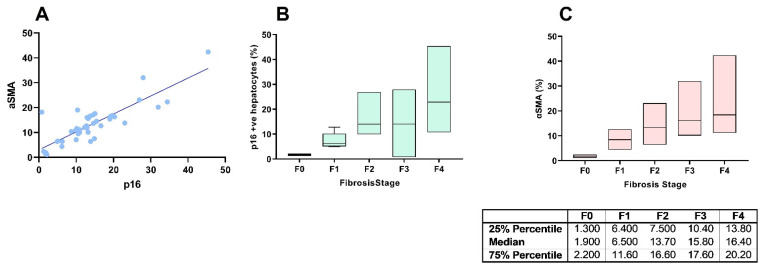
Figure 1.
Associations between proportion of senescent hepatocyte (represented by positive p16 staining) and hepatic stellate cell activation (represented by αSMA expression) (A); proportion of senescent hepatocytes (represented by positive p16 staining) and liver fibrosis stage (B); hepatic stellate cell activation (represented by αSMA expression) and liver fibrosis stage (C).

