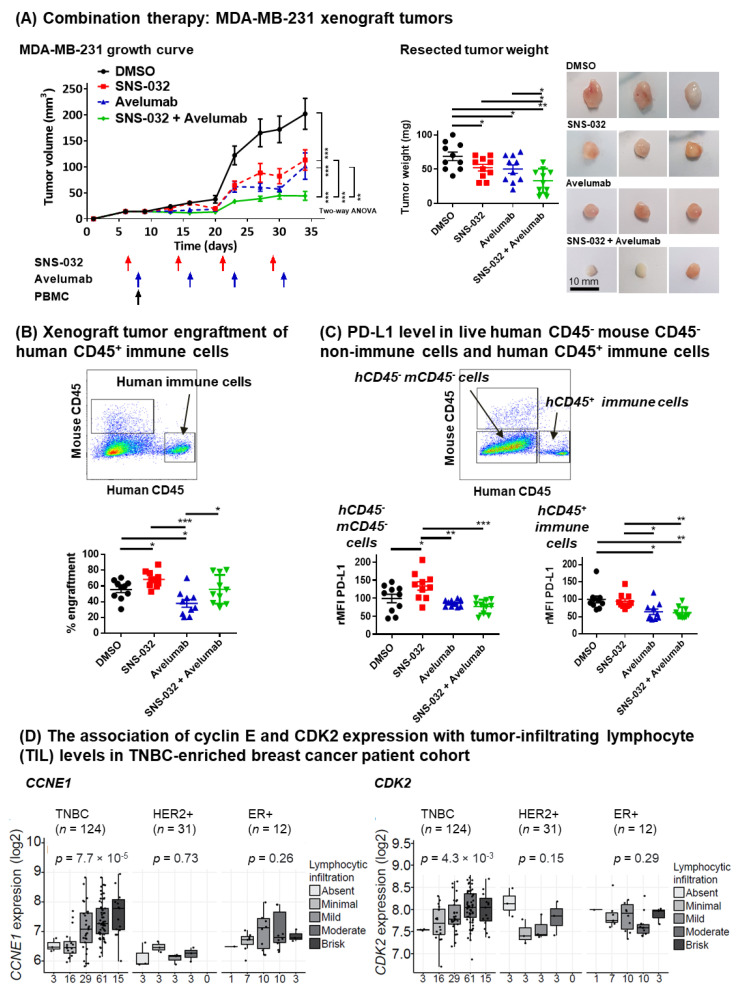
Figure 5.
Combination treatment of SNS-032 with anti-PD-L1 avelumab antibody. (A) Tumor growth measurements following inoculation (left), resected tumor weights (middle) and representative tumor photographs (right) of MDA-MB-231 tumors of the partly immuno-humanized mice treated with DMSO, SNS-032 inhibitor alone, avelumab antibody alone, or with sequential dosing with SNS-032 and avelumab (n = 10 mice per condition). Once palpable tumors were formed, mice received an intravenous injection of SNS-032 (15 mg/kg) (on Day 6), followed by avelumab (10 mg/kg) pre-mixed with a single dose of human healthy volunteer PBMC to provide effector cells (on Day 9). Subsequent inhibitor doses (Day 13, 20, 27) and antibody doses (Day 16, 23, 30) were given weekly. (B) Human immune cell engraftment in mouse tissues (% engraftment) was calculated using the formula: human CD45+ cells/(human CD45+ cells + mouse CD45+ cells) × 100%. (C) PD-L1 expression levels of live non-immune cells (human and mouse CD45− cells) (left) and live human CD45+ immune cells (right) were measured by flow cytometry with anti-human CD274 staining of extracted xenograft tumors. All p-values were reported with the following associated symbols: p < 0.05 (*), p < 0.005 (**), p < 0.0005 (***), and all tests were two-sided. (D) CIBERSORT was used for the immune cell analysis of the Guy’s cohort gene expression data. Lymphocytic infiltration levels were classified into five groups: absent, minimal, mild, moderate and brisk. Numbers of patients per group are indicated below the graphs. p-values were determined using Mann–Whitney U test for the CIBERSORT data.

