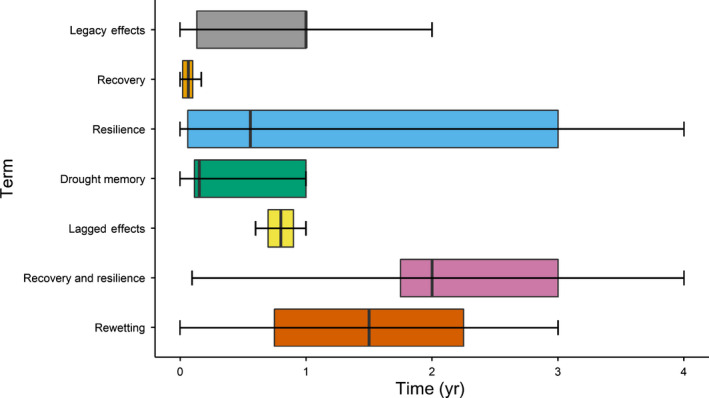
Fig. 2.

Box plots with median bars (outliers not shown) showing the average time after drought that each study measured responses with respect to the terms used. The boxes represent the interquartile range that contain the 25th percentile and 75th percentile range of the data. The whiskers represent 1.5 times the interquartile range for the minimum and maximum whisker. The category ‘recovery and resilience’ includes papers that used both the terms recovery and resilience, while the categories ‘recovery’ and ‘resilience’ include papers that only used the terms individually.
