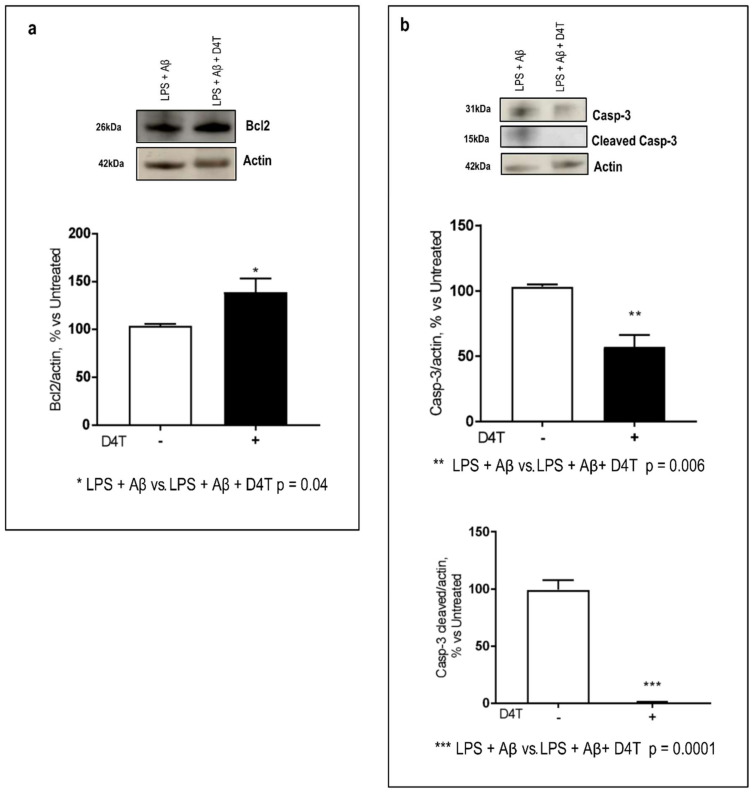
Figure 5.
Caspase-3/cleaved-Caspase3 and Bcl2 production. Western blot analysis of Bcl2 ((a) 26 KDa) and Caspase-3 ((b) 31 KDa) and cleaved Caspase-3 ((b) 15 KDa) were evaluated. Each result is expressed as a percentage of the ratio between each target and actin expression versus D4T-untreated cells. Statistical significance is shown as (*** p < 0.0001, ** p < 0.001, * p < 0.05). Representative blots from independent experiments are shown in the panels (a,b).

