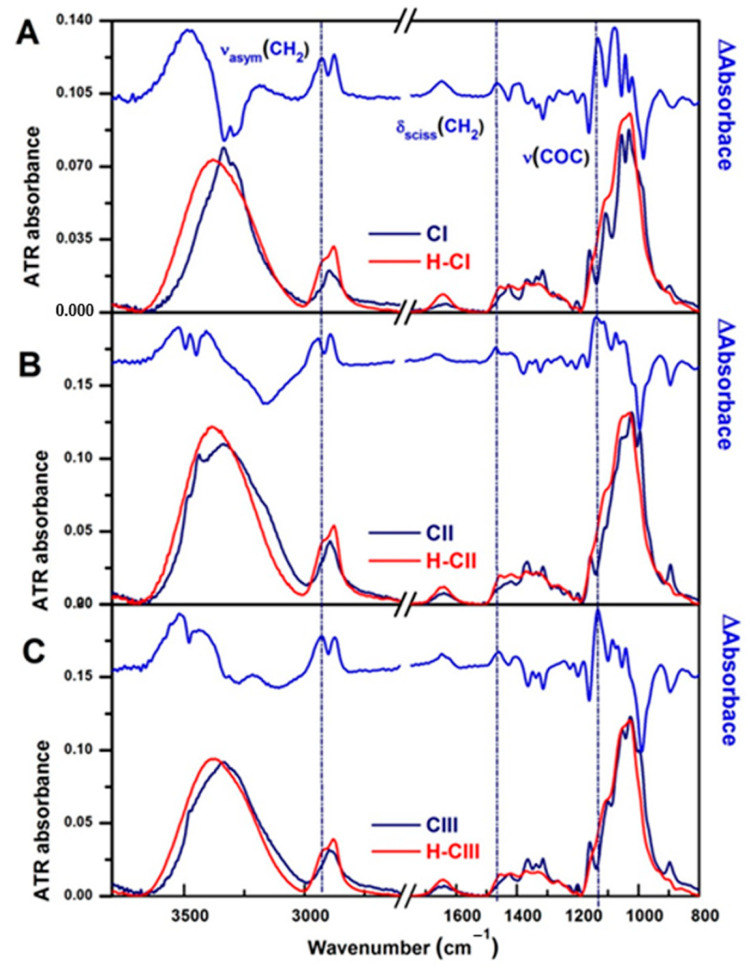
Figure 10.
ATR-FTIR spectra comparison of cellulose allomorphs (dark blue line) with those of their corresponding hydrogels (red line): (A) CI and H-CI, (B) CII and H-CII, and (C) CIII and H-CIII. The difference spectrum [H-Ci – Ci] is added to the top of each figure (blue line). The vertical dotted lines mark the position of the characteristic bands of the chemical cross-linking of cellulose with ECH.

