Figure 6.
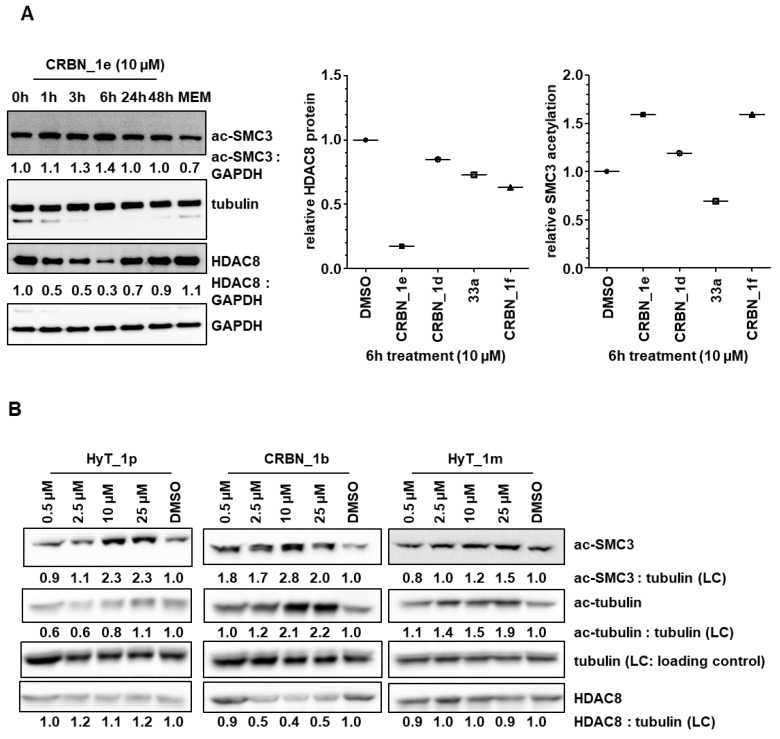
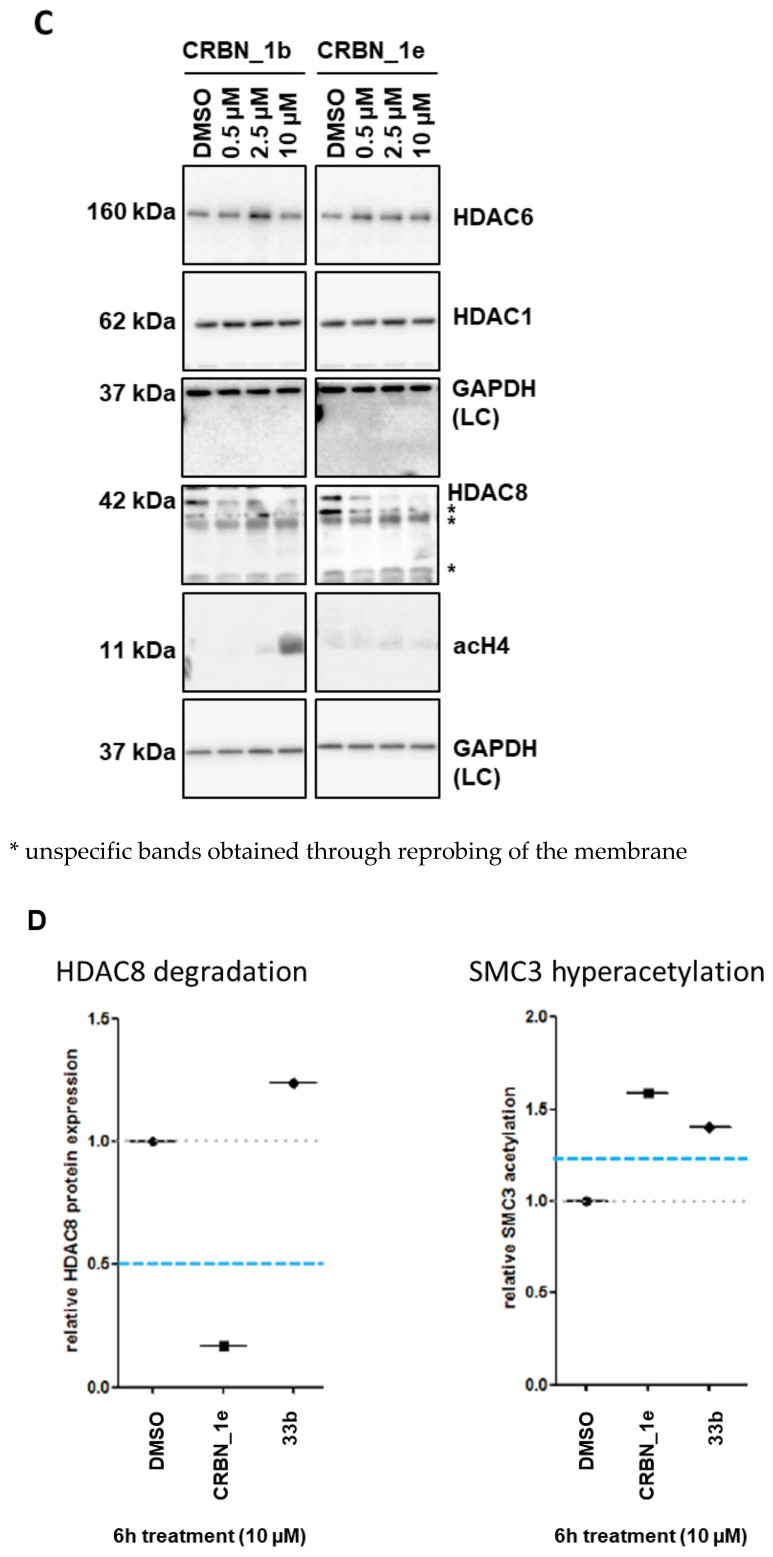
(A) SK-N-BE(2)-C neuroblastoma cells were treated for indicated time points with 10 µM of PROTACs. Degradation of HDAC8 and acetylation of HDAC8 target was analyzed via Western blot. (B) SK-N-BE(2)-C neuroblastoma cells were treated for 6 h with indicated concentrations of HyT_1p, CRBN_1b and HyT_1m. Acetylation of HDAC8 target SMC3 and HDAC6 target tubulin, as well as total HDAC8 levels, were assessed by Western blot. Quantified ac-SMC3 or ac-tubulin expression, respectively, was normalized to the respective tubulin loading control and to the solvent control (DMSO). This quantification is reflected by the numbers below each blot. (C) SK-N-BE(2)-C neuroblastoma cells were treated for 6 h with indicated concentrations of PROTACs CRBN_1b and CRBN_1e. Total HDAC6, total HDAC1, total HDAC8, and acetyl-histone H4 expression levels, were assessed by Western blot. Total GAPDH protein levels served as a loading control (LC). * unspecific bands obtained through reprobing of the membrane. (D) HDAC8 degradation and SMC3 hyperacetylation profiles of negative control 33b (HDAC8 inhibitor with an IC50 of 698 ± 41 nM) compared to PROTAC CRBN_1e.


